Tutorials and Resources for DIY Sensors
Jump to: Sap flow sensors, Video tutorial, or Voltage loggers for FloraPulse microtensiometers.
So you want to build your own sensors?
When I began my PhD in 2022, I wanted to determine how much groundwater was being consumed by coconut plantations on Pacific atolls. Sap flow sensors were a logical way to approach this, but without a huge equipment budget, there was no way for me to get a large enough sample size to confidently answer my question.
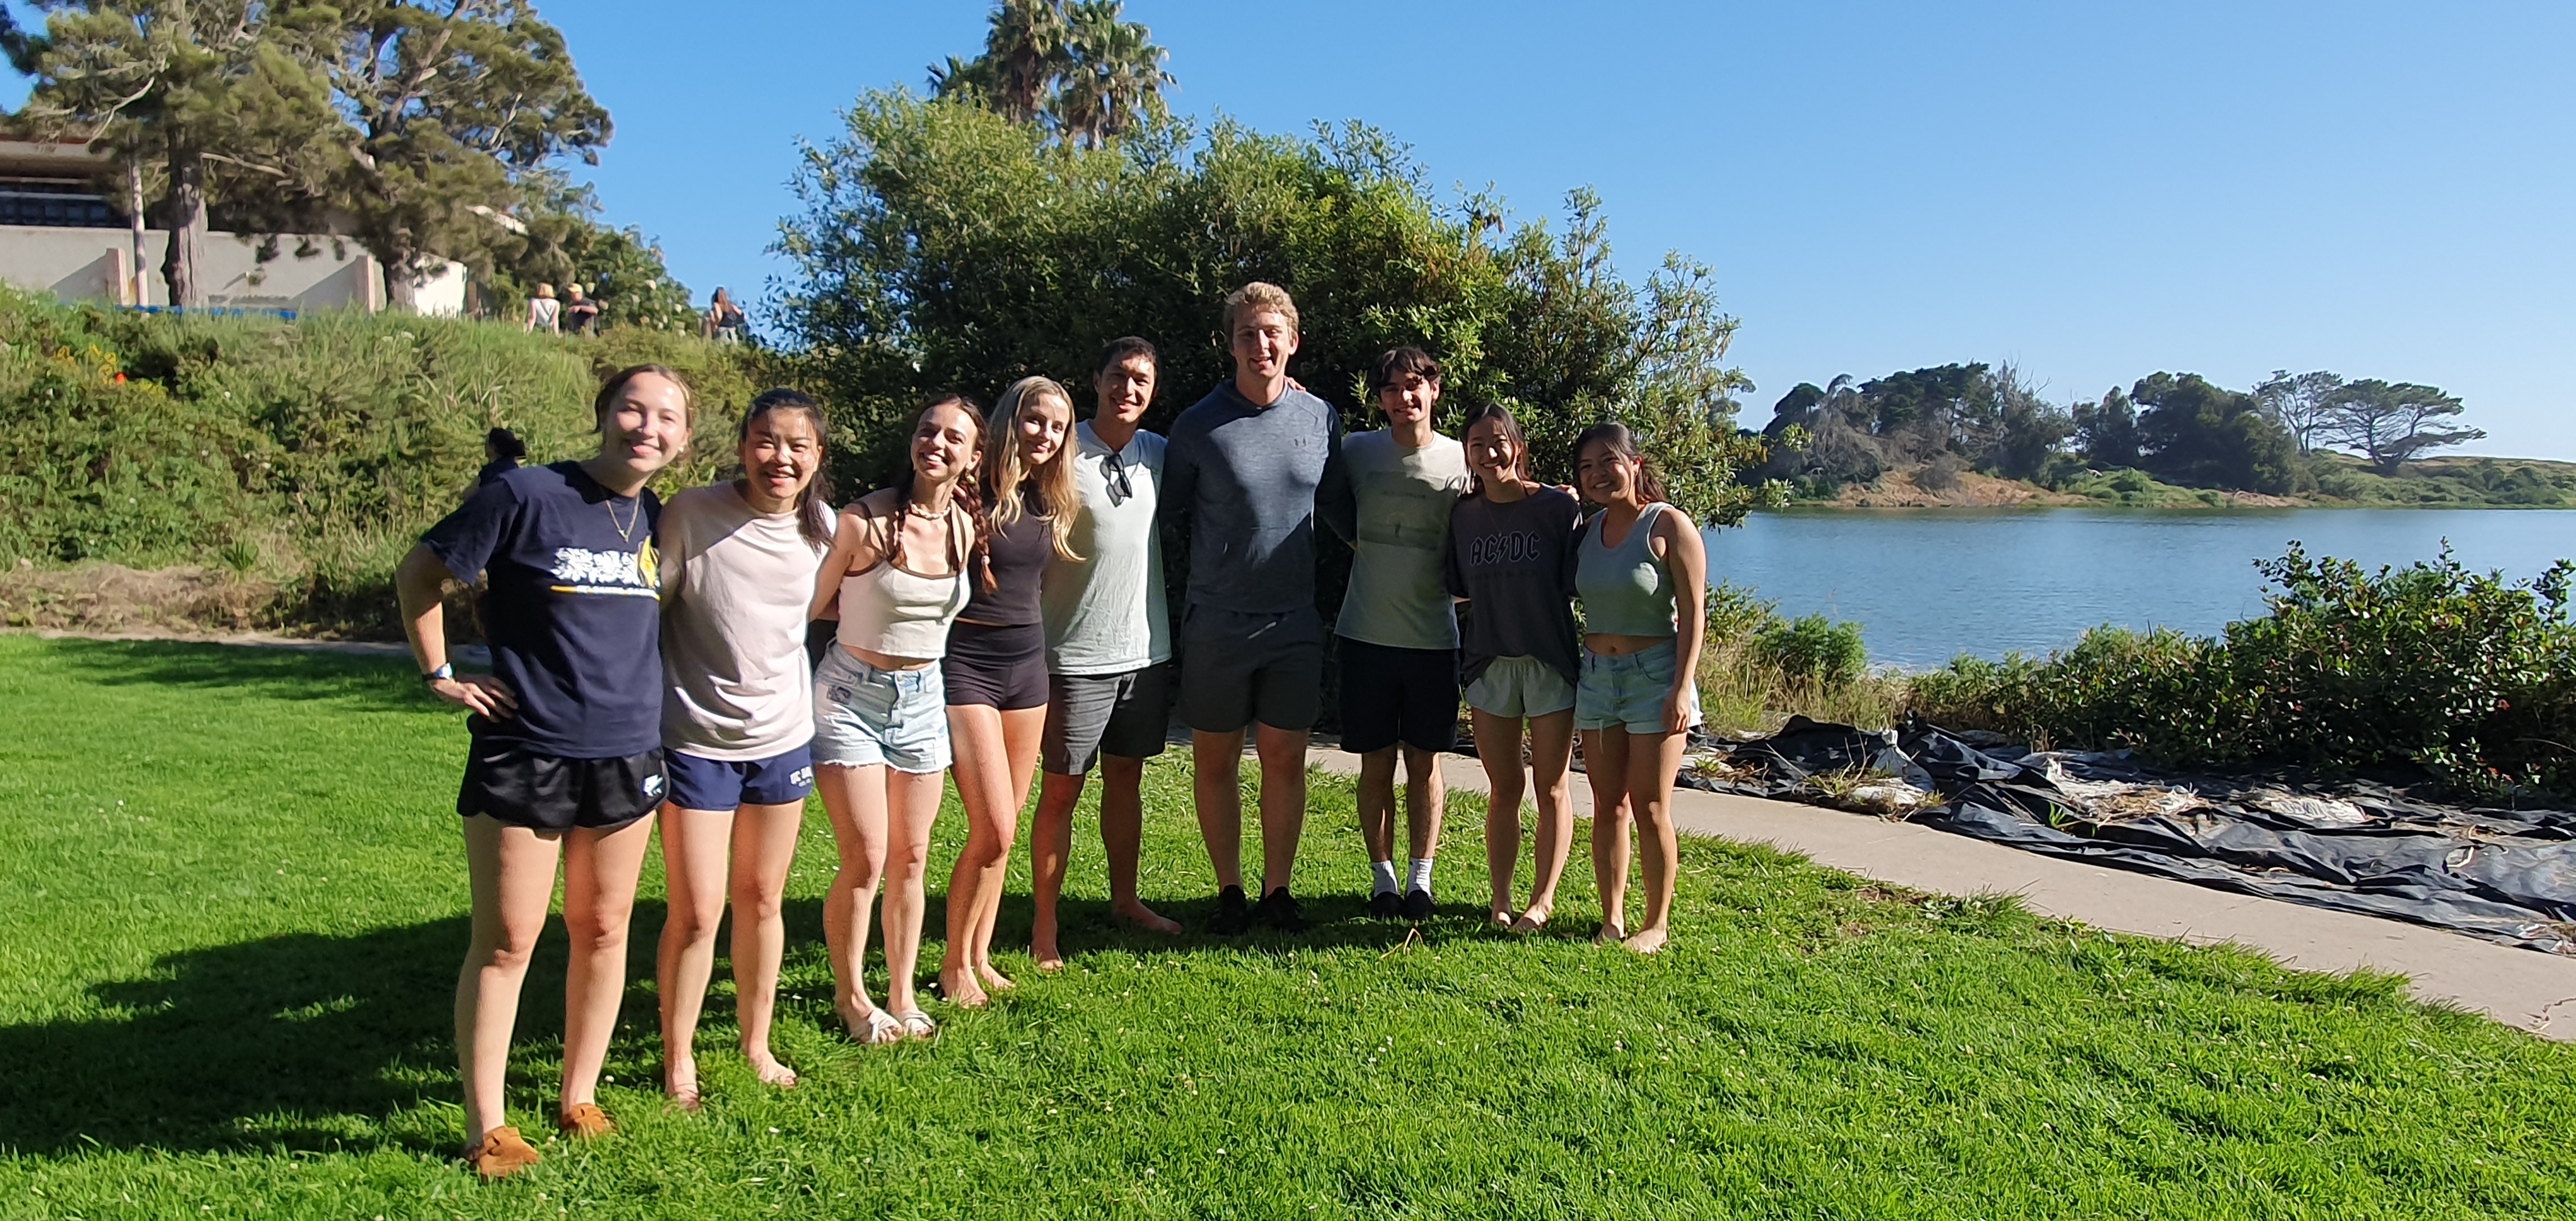
After seeing Justin Beslity’s 2022 paper in HardwareX, I was inspired to try building my own low-cost sensors. I had a tiny bit of electronics know-how and considered myself a good tinkerer, but was (am) certainly no electrical engineer. It took about four months of R&D to settle on a design and build a few working prototypes, three months of assembly-line-style building with a wonderful team of 8 undergraduate research assistants, and another month of testing and design refinements before I deployed my first 40 sensors on a remote Pacific island.
Two years and ~250 sensors later, I consider my foray into sensor design to have been time well spent. But anybody considering the DIY route should carefully weigh the investments and risks that come with it: even using an established design, you must anticipate countless cycles of trial and error! You may receive bad batches of parts, or make tiny mistakes in the build process that end up causing catastrophic failures. You will need to train assistants to scale up your operation, which takes time and patience but is ultimately so rewarding. Sap flux measurements are also inherently difficult and noisy, and my sensor design–which is far from perfect–requires constant diligence to ensure the sensors are collecting usable data.
But with all that said, they worked. So good luck to you, and please don’t hesitate to contact me with questions.
Sap Flow Sensors
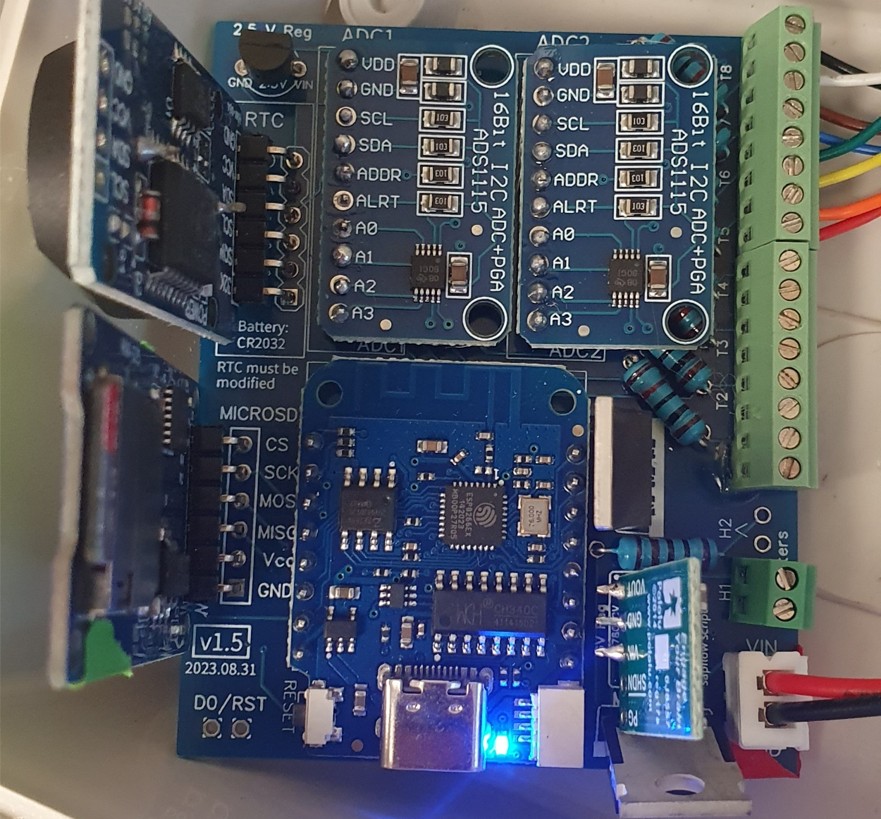
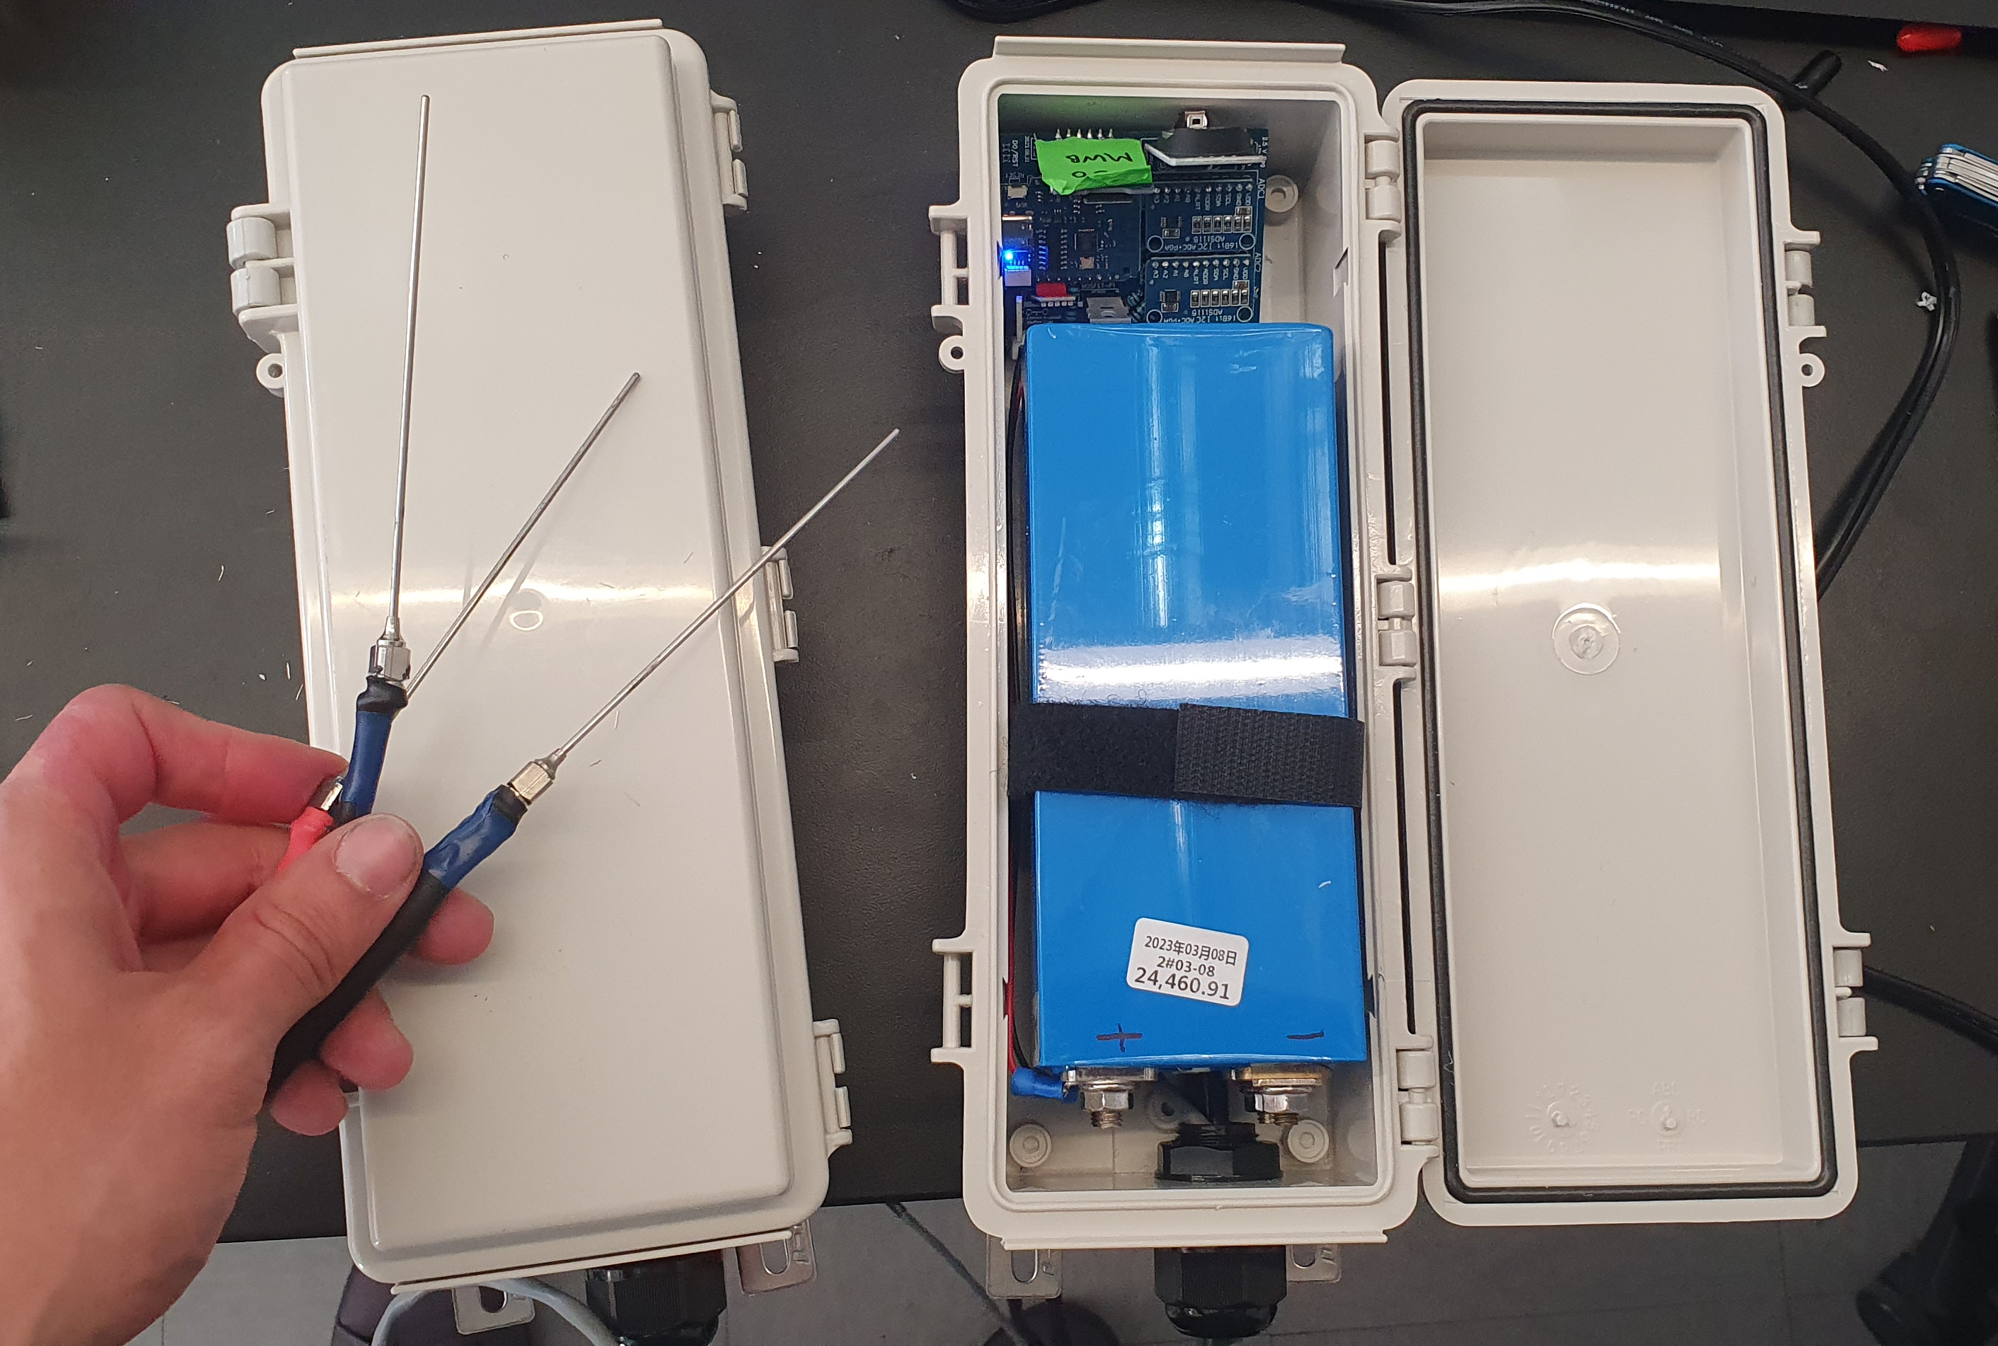
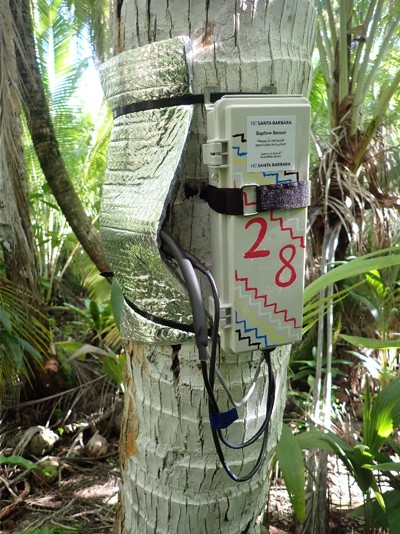
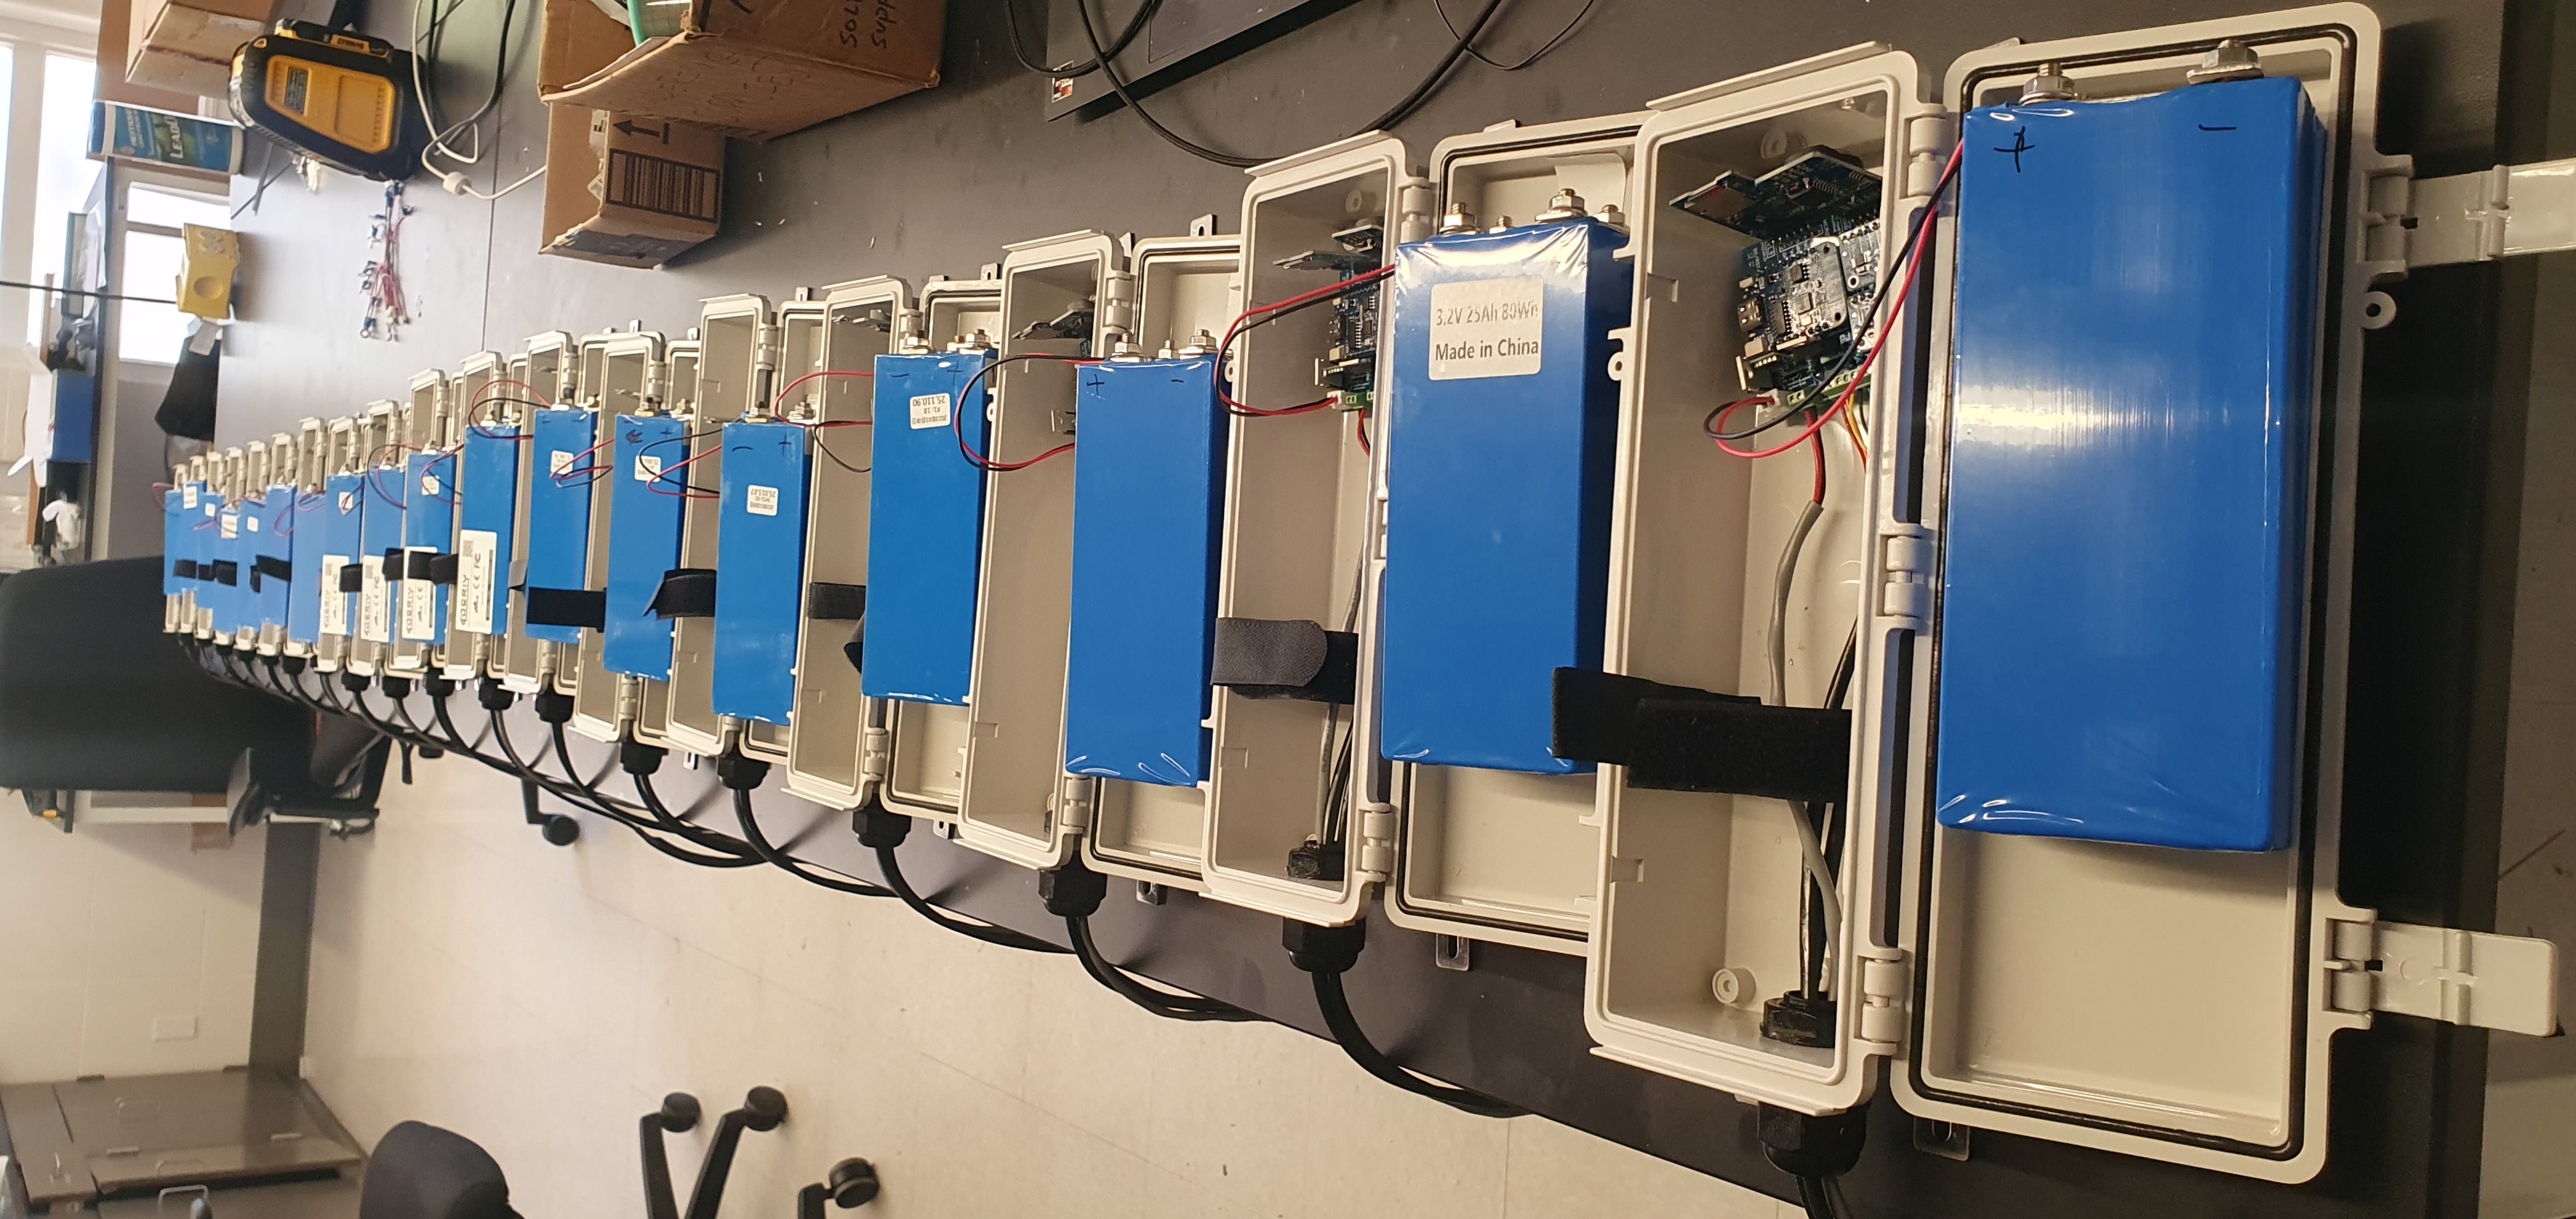
These sensors are versatile temperature measurement and logging devices that can be used for a wide range of heat pulse velocity (HPV) sap flux measurement techniques. In their present configuration, the sensors feature two steel probes with four thermistors each, an identical steel probe with a heater wire inside, and the ability to log temperature data from the eight thermistors at sub-second resolution as programmed by the user. Excluding development time, we eventually reached marginal costs of ~$190 and 5 hours of labor per sensor.
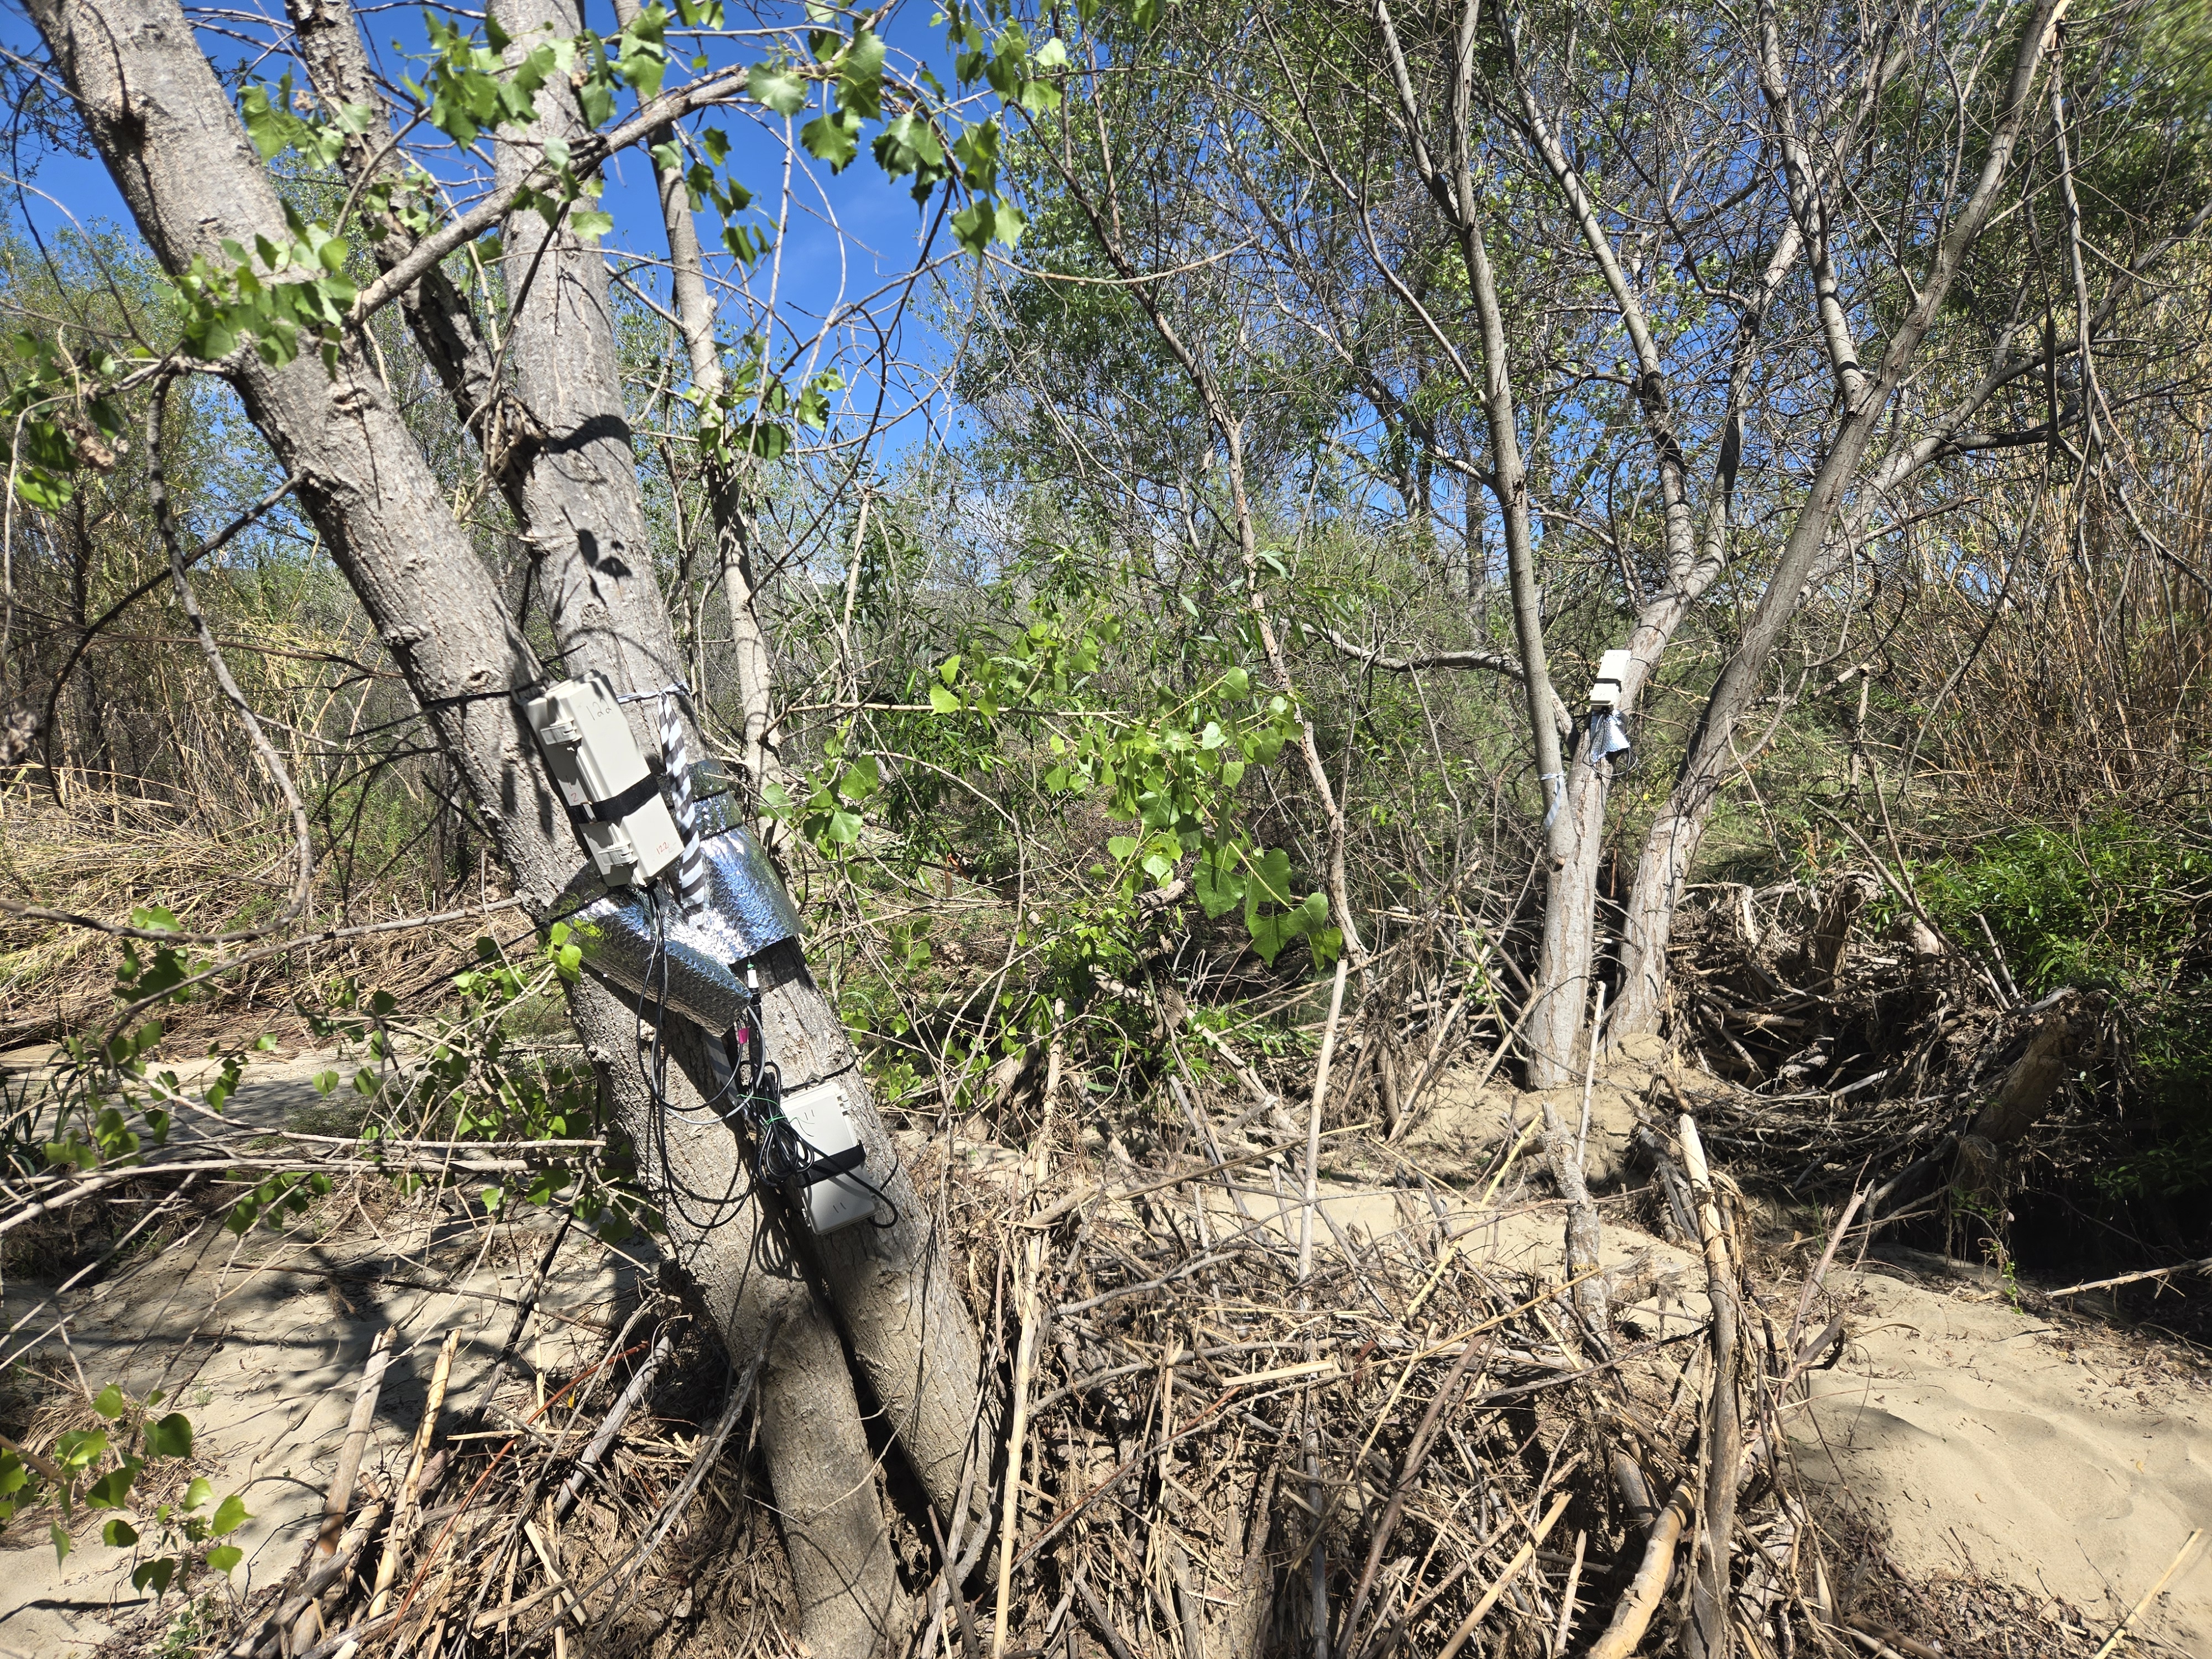
Because my sensors were designed for deployment beneath a dense tropical forest canopy, I decided early against the use of solar panels and instead decided to maximize battery capacity. If nighttime measurements are minimized, I typically get 6-8 months of half-hourly measurement cycles out of the 25 Ah batteries. I never implemented any telemetry in the interest of saving power (and because there was no cellular service in my study system), but it is certainly possible to add it to these sensors. This design has proven reliable and resilient in a variety of wet tropical environments and exposed arid environments, and the lack of long cables running to external data loggers or solar panels reduces failure points and increases versatility relative to many commercial systems. But of course, every aspect of the design can be changed to fit the user's needs.
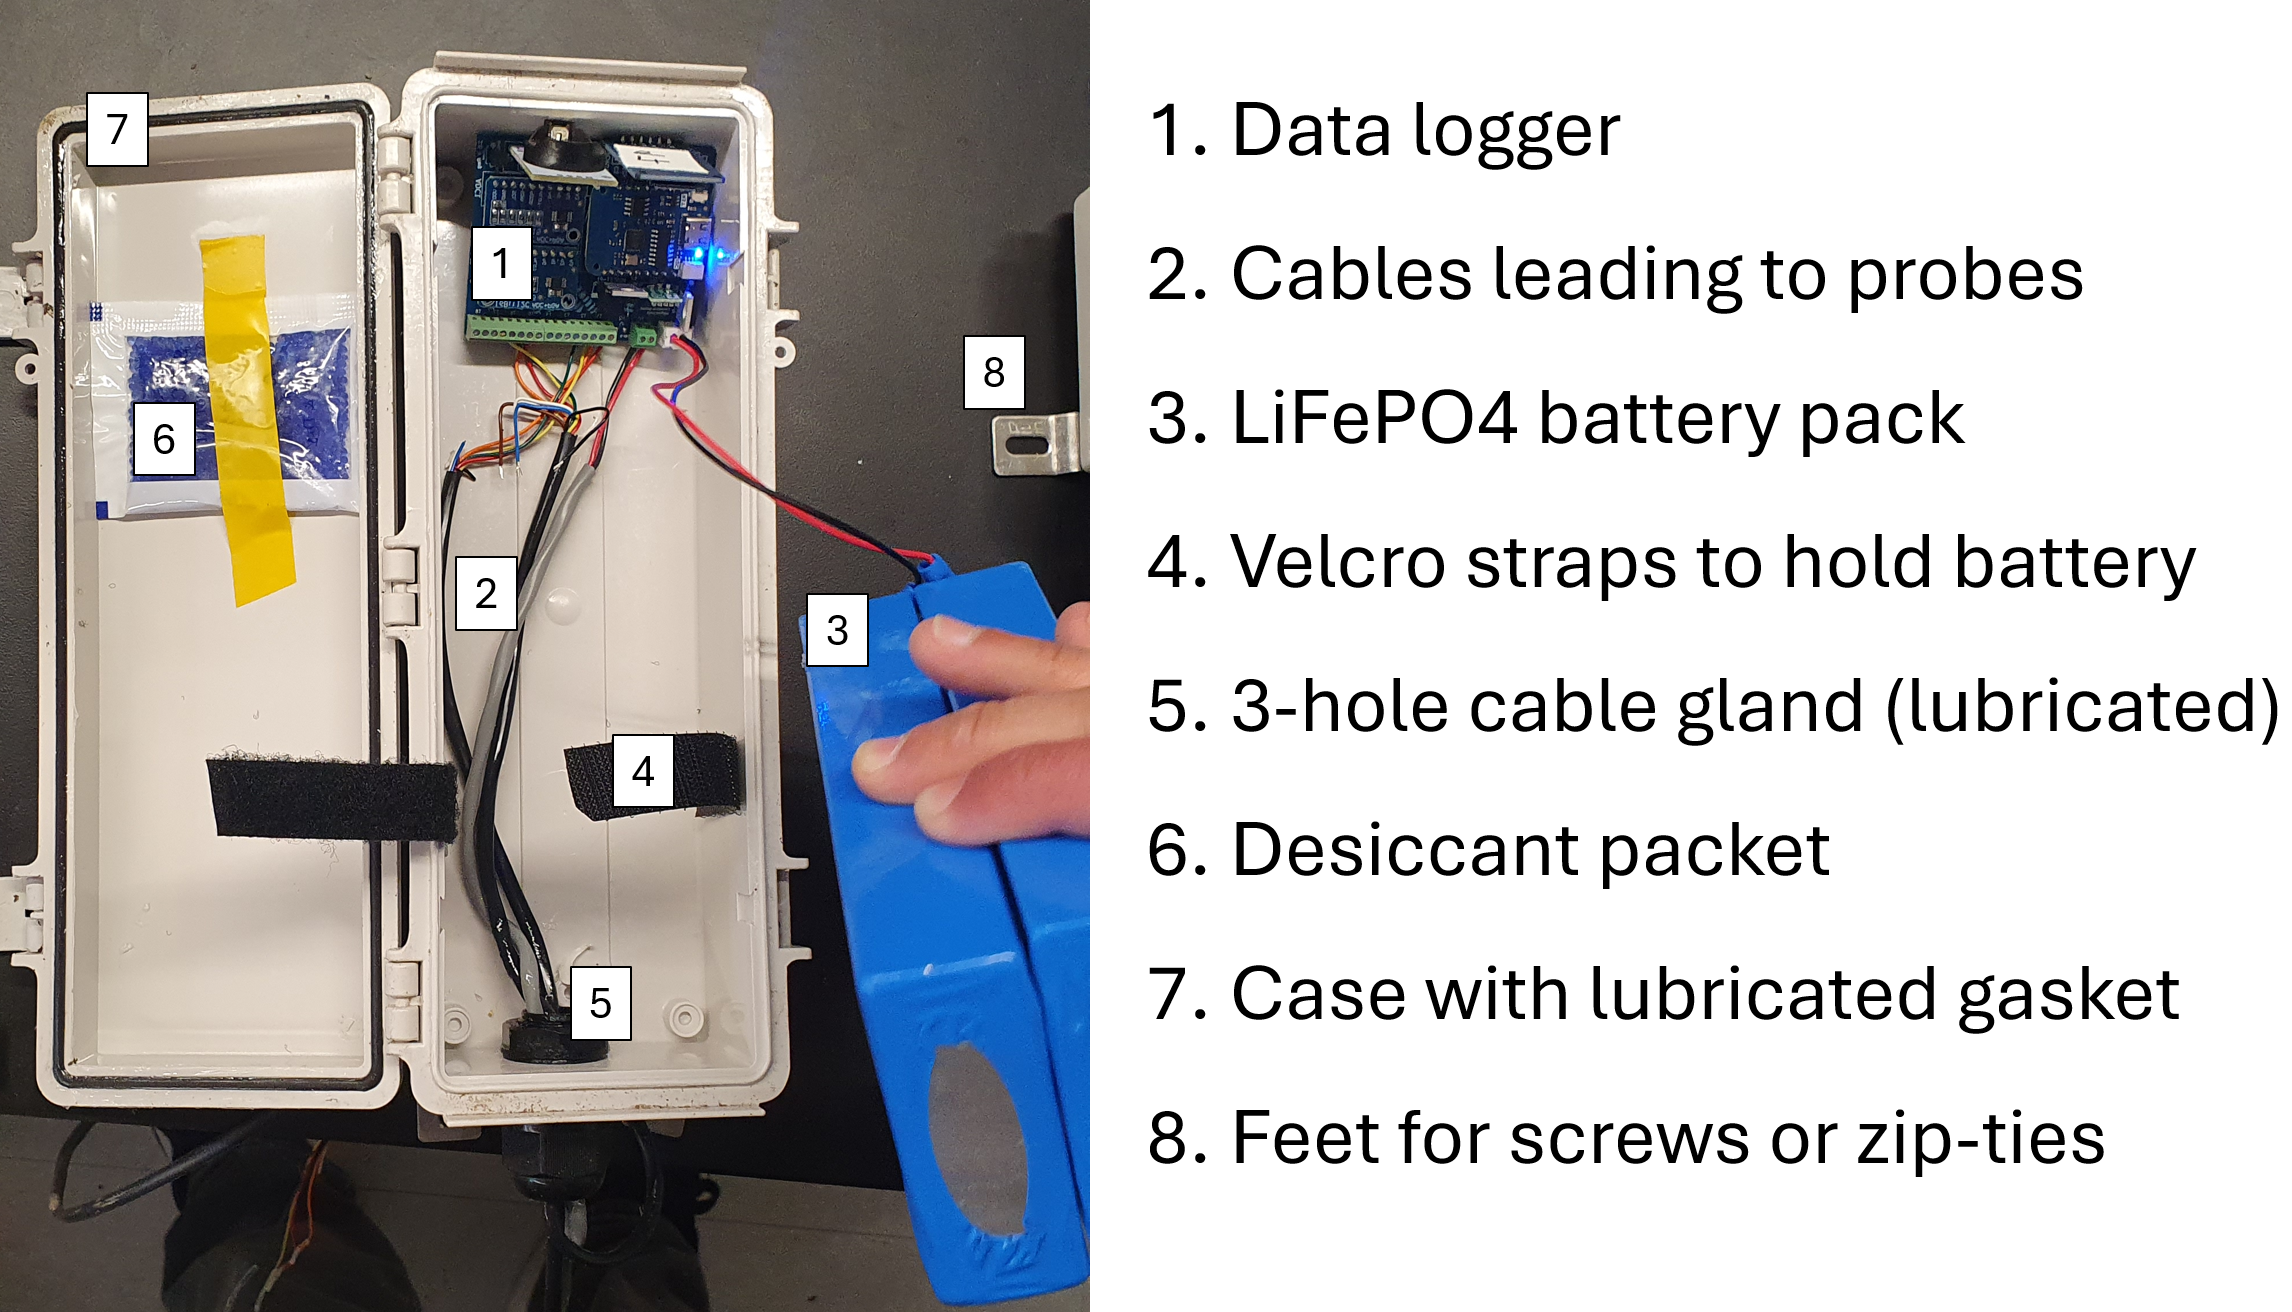
Our sensors are based heavily on the “Js5” design of Beslity et al. (2022), whose schematics and code are available online. The Js5 PCB design has been altered here to reduce its size, but its circuitry is virtually unchanged, so Beslity et al.'s paper and schematics are essential reading. The largest changes I made to the Js5 design are the use of a more efficient step-up/step-down voltage regulator that can accommodate batteries in the ~6-7V range and that operates the sensor at 5V rather than 6V to improve power efficiency, different wire terminals to save space, large LiFePO4 batteries to replace the original NiMH power system, and consolidated wiring to reduce entry points into the plastic outer case.
How do they work?
While the exact means of estimating sap flux density depend on the method used, these sensors generally operate by releasing a pulse of heat from the heater probe and looking for that pulse of heat using the thermistor probes. By measuring how long it takes for that pulse of heat to reach the strategically placed thermistor probes, you can estimate the rate of convection (i.e. sap flux) in the xylem.
These sensors estimate the heat pulse velocity once per measurement cycle. Measurement cycles are usually about two minutes long and occur however often the user programs them--typically 15-30 minutes apart. Thus, these sensors spend most of their time powered down between measurement cycles, with their data loggers totally disconnected from their batteries by a MOSFET (which acts like a switch) so absolutely no power is being drawn. But while most of the logger is shut off, a Real-Time Clock (RTC) with its own watch battery is keeping time on its own, and when it reaches a programmed "alarm" time, it flips the MOSFET switch and allows the battery to power the data logger.
Now that the data logger is awake, it quickly checks that the battery is not too low. It also checks the current time and makes sure it's not currently a nighttime hour that the user has programmed it to skip. Then it begins sending electricity through its eight thermistors, each of which features a resistance that depends on its temperature. Each thermistor is on its own circuit with its own resistance that depends on the thermistor temperature, and each circuit has its own analog voltage. The Analog-Digital Converters (ADCs) record these voltages and convert them to digital values, which the D1 microprocessor converts to temperatures twice per second and sends off to the microSD card.
For most heat pulse velocity measurement methods, the data logger spends a while recording baseline temperatures. After a while (typically 5-10 seconds), the D1 microprocessor sends a signal to switch on another MOSFET that controls the heater probe. Power flows through the resistive wire inside that probe until the D1 flips the MOSFET switch, generating a heat pulse of user-configured duration (typically 2 to 8 seconds). The thermistors have continued logging temperature data during the heat pulse and continue for a pre-set amount of time (often ~100 seconds), capturing the time period during which the thermistors "see" the heat. Then the first MOSFET is switched off and the logger is powered down.
Sourcing components
When you start ordering parts, I recommend you order enough to build at least twice as many thermistor probes and data loggers as you need. My first batch of data loggers had a 50% failure rate, although I eventually improved that with breadboard testing. Probes can also break or go bad so having spares is essential.
Almost all of the necessary parts can be purchased from online vendors without manufacturing delays. One exception may be the tiny thermistors used in the probes. Models available on electronics storefront websites fluctuate in price; Beslity et al. purchased theirs for less than $3 each, but the same part was ~$20 each when I began my project. I ended up custom ordering them from North Star Sensors LLC, a US manufacturer based in Oceanside, for ~$8 each. I also evaluated similarly priced samples from Jingpu Semiconductor, a manufacturer based in China, but ultimately chose Northstar for lower shipping costs.
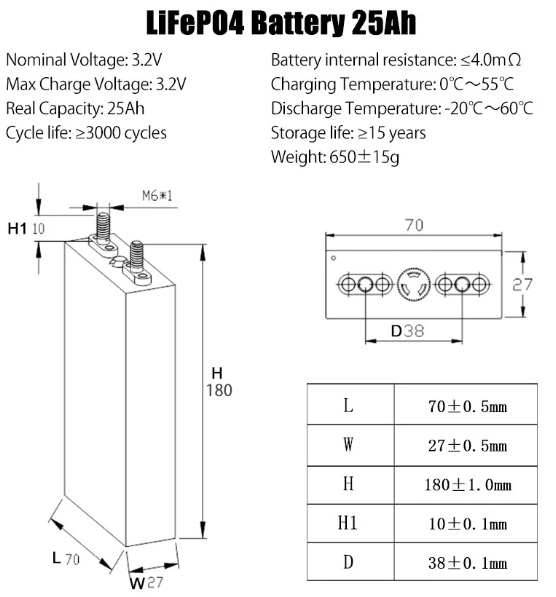
Batteries may pose another sourcing challenge. I used a specific size of prismatic LiFePO4 cells that fit snugly in my cases, but had to keep looking for new importers and retailers every time I ordered a batch. Many vendors did not seem to keep them in stock, and such batteries are generally in high demand for mobility applications.
I ordered my PCBs from JLCPCB, a Chinese manufacturer that has a direct interface with EasyEDA, an online PCB designer website. EasyEDA allows you to uploaded a Gerber file to print existing PCB designs; the Js5 PCB design can be found by following links in their paper, and my most recent PCB design can be downloaded here.
You will need steel needles to build the probes. I found 16-gauge needles to be the right balance between size, strength, and ease of construction, and I prefered all-steel needles to those with plastic luer-slip connectors. I bought 2-inch and 4-inch needles from McMaster-Carr, and they also offered 6-inch needles, but I suspect these would be hard to keep aligned in the tree (not to mention the difficulty of drilling a 1.7 mm diameter hole 6 inches into a tree!). I also built some 1-inch sensors, but for those needles I had to hunt around on eBay.
In order to keep costs down, many of these parts are knock-offs purchased for cheap on Amazon. There is an obvious reliability trade-off here, but I found that by testing parts before soldering, the savings were generally worth it. With that said, I strongly recommend purchasing the microSD cards and coin cell batteries from reliable sources. This means avoiding "marketplace" retailers like eBay, Amazon, Alibaba, and Walmart, and instead purhasing from reputable vendors like B&H, Adorama, Mouser, Digi-Key, or even brick and mortar stores like Costco or Micro Center. I purchased a large order of SanDisk microSD cards from what was advertized as the offical SanDisk store on Amazon, but ended up receiving counterfeit cards that failed after a few months and lost all my data. Don't risk it!
The following parts list includes most of the components needed to build a sap flow sensor, with probably outdated prices from March 2024. Some of the parts names are confusing, so if you are unsure if it's correct, try to compare it to the pictures and video on this page.
Parts list:
Data loggers
| Part | Model | Number | Cost per unit - USD | Vendor |
|---|---|---|---|---|
| PCB | UCSB.sapflow.v1.5 | 1 | $1.10 | JLCPCB |
| Microcontroller | Lolin Wemos D1 Mini | 1 | $4.50 | Lolin via AliExpress |
| ADC | ADS1115 | 2 | $3.00 | Amazon |
| RTC | DS3231SN | 1 | $3.00 | Amazon |
| 2.5 V Reference | LT1460GIZ-2.5#PBF | 1 | $5.20 | Digikey |
| 5 V Regulator | S7V7F5 | 1 | $7.19 | Pololu |
| P-Channel MOSFET | IRF9540NPBF | 1 | $1.49 | Newark |
| N-Channel MOSFET | IRLZ34PBF | 1 | $2.15 | Newark |
| MicroSD Card Adapter | MicroSD Card Adapter (HW-125) | 1 | $1.20 | Amazon |
| MicroSD Card | Lexar 633x 32GB microSDHC card | 1 | $4.99 | B&H Photo and Video |
| Lithium Coin Cell Batteries | Duracell CR2032 3V batteries | 1 | $1.41 | Costco |
| Terminal block connectors (heater probes) | 2-Pin 2.54mm Pitch Screw Terminal Block Connector | 1 | $0.45 | Amazon |
| Terminal block connectors (thermistor probes) | 8-Pin 2.54mm Pitch Screw Terminal Block Connector | 2 | $0.80 | Amazon |
| 1K ohm Resistors | 1K ohm 0.5W resistors | 1 | $0.11 | Amazon |
| 10K ohm Resistors | 10K ohm 0.5W resistors | 9 | $0.11 | Amazon |
| 100K ohm Resistors | 100K ohm 0.5W resistors | 1 | $0.11 | Amazon |
| Total | $41.49 |
Note: for better reliability, you can purchase higher-quality versions of the ADS1115 and DS3231 RTC from Jameco Electronics under the Velleman brand, but they are much more expensive.
Probes
| Part | Model | Number | Cost per unit - USD | Vendor |
|---|---|---|---|---|
| Heater Wire | TFCC-005 PFA insulated wire | ~1 ft | $0.75/ft | DwyerOmega |
| Thermistors | 10K NTC Thermistor (3BT103R44T1A) | 8 | $8.17 | North Star Sensors |
| Stainless Steel Dispensing Needle | 6710A43 (16-gauge, 4-inch) | 3 | $4.28 | McMaster Carr |
| Thermal paste | Generic CPU thermal paste (1 g luer-slip syringe) | 1 | $0.40 | Amazon |
| Thermal epoxy | MG Chemicals 8329TFS | ~3 mL | $3.60/mL | Amazon |
| Heat shrink tubing for thermistor probe exteriors | 3/8" 3:1 Adhesive-lined Heat Shrink Tubing | 4 ft | $0.50/ft. | Amazon |
| Heat shrink tubing for thermistor probe interiors | Heat Shrink Tubing - 1/16 in - Clear Polyolefin - 2:1 Industrial Shrink Tube & Cable Sleeve | 2 ft | $0.14/ft | Amazon |
| Heater probe cable | 2C cable M13302 SL005 | 3 ft | $0.52/ft | Digikey |
| Thermistor probe cable | 8C cable 50AC8143 | 6 ft | $0.26/ft | Newark |
| Total | $95.55 |
Case and batteries
| Part | Model | Number | Cost per unit - USD | Vendor |
|---|---|---|---|---|
| LiFePO4 batteries | 25 Ah 3.2v LiFePO4 prismatic cells (180x70x27mm) | 2 | $17.10 | Sriko Batteries; Battery Hookup; Electric Car Parts Company; SeLian Energy |
| Battery cables and board connectors | 2.54mm JST-HX 22AWG pre-crimped 20 cm wire set | 1 | $1.50 | Amazon |
| Cable gland | 3 Hole Nylon Cable Gland M20 (CGO-6103) | 1 | $1.20 | Cableglandsonline.com |
| Battery nuts | M6-1.0 serrated flange hex nuts | 4 | Usually included with batteries | |
| Battery bar | 1 | Usually included with batteries | ||
| Battery connectors | M6 wire crimp ring terminals | 2 | $0.08 | Amazon |
| Waterproof case | Polycase WH-08 | 1 | $13.97 | Polycase |
| Velcro battery straps | Sew-on non-adhesive Velcro tape | 6 in | $0.30/ft | Amazon |
| Velcro cinch strap (sensor exterior) | 18-inch velcro cable strap | 1 | $0.57 | Amazon |
| O-ring grease | Super Lube Silicone O-Ring Grease | (small amount) | $30/tub | Amazon |
| Desiccant packs | Dry & Dry 10 gram indicating desiccant packs | 1 | $0.30 | Amazon |
| Total | $52.05 |
Power options
As currently configured, the sap flow sensors should be able to operate with 2.7 to 11.8 V of input power, as determined by the 5V regulator. This could be supplied by a number of battery options, with or without solar power, or by any other DC power supply, but note that the 5V regulator is most efficient with an input voltage around 6V. The Pololu S7V7F5 regulator was chosen mostly because it is a drop-in replacement for typical 6V linear regulators and thus didn’t necessitate a PCB redesign, but it also has the advantage of higher effeciency and flexible input voltages. Note that according to my logging multimeter, 300 mA is the maximum current draw of the datalogger with a 25-ohm, 4” heater, but that this amperage would be higher with a shorter heater (which has less resistance if less heater wire is used).
Power options could potentially be even wider with a different voltage regulator. I like the Pololu regulators listed above because they’re efficient and small, but anything that outputs enough volts for the Lolin D1 and the SD card adapter (which I think may require more than 3.3v) would work in place of the Pololu unit. If you use a different voltage regulator, be conscious of dropout voltages and make sure you’ve got enough volts going in.
Building a sap flow sensor
Tutorial video
Check out this video to see all the steps of building a sap flow sensor! Filmed and edited by Talula Wilmot.
The data logger
- Before we begin: it’s really, really critical to make good solder joints! Make sure you’re melting the solder all the way into the hole and getting 360-degree coverage, and use a spare PCB and some resistors to practice.
- If you print PCBs with my Gerber files (or those of the Js5), the MOSFET stencil outlines printed on the PCB surface are drawn backward. Refer to the pictures in this guide or Fig. 17 in Beslity et al. (2022) to see what I mean.
Required tools/supplies:
- Soldering iron
- Wire snips
- Solder (if you need lead-free, I found Weller WSW SCN M1 worked well)
Recommended tools/supplies:
- Solder sucker
- Solder wick
- Breadboard and jumper cables
- Soldering station with "helping hands"
Step 1: Prepare the breakout boards
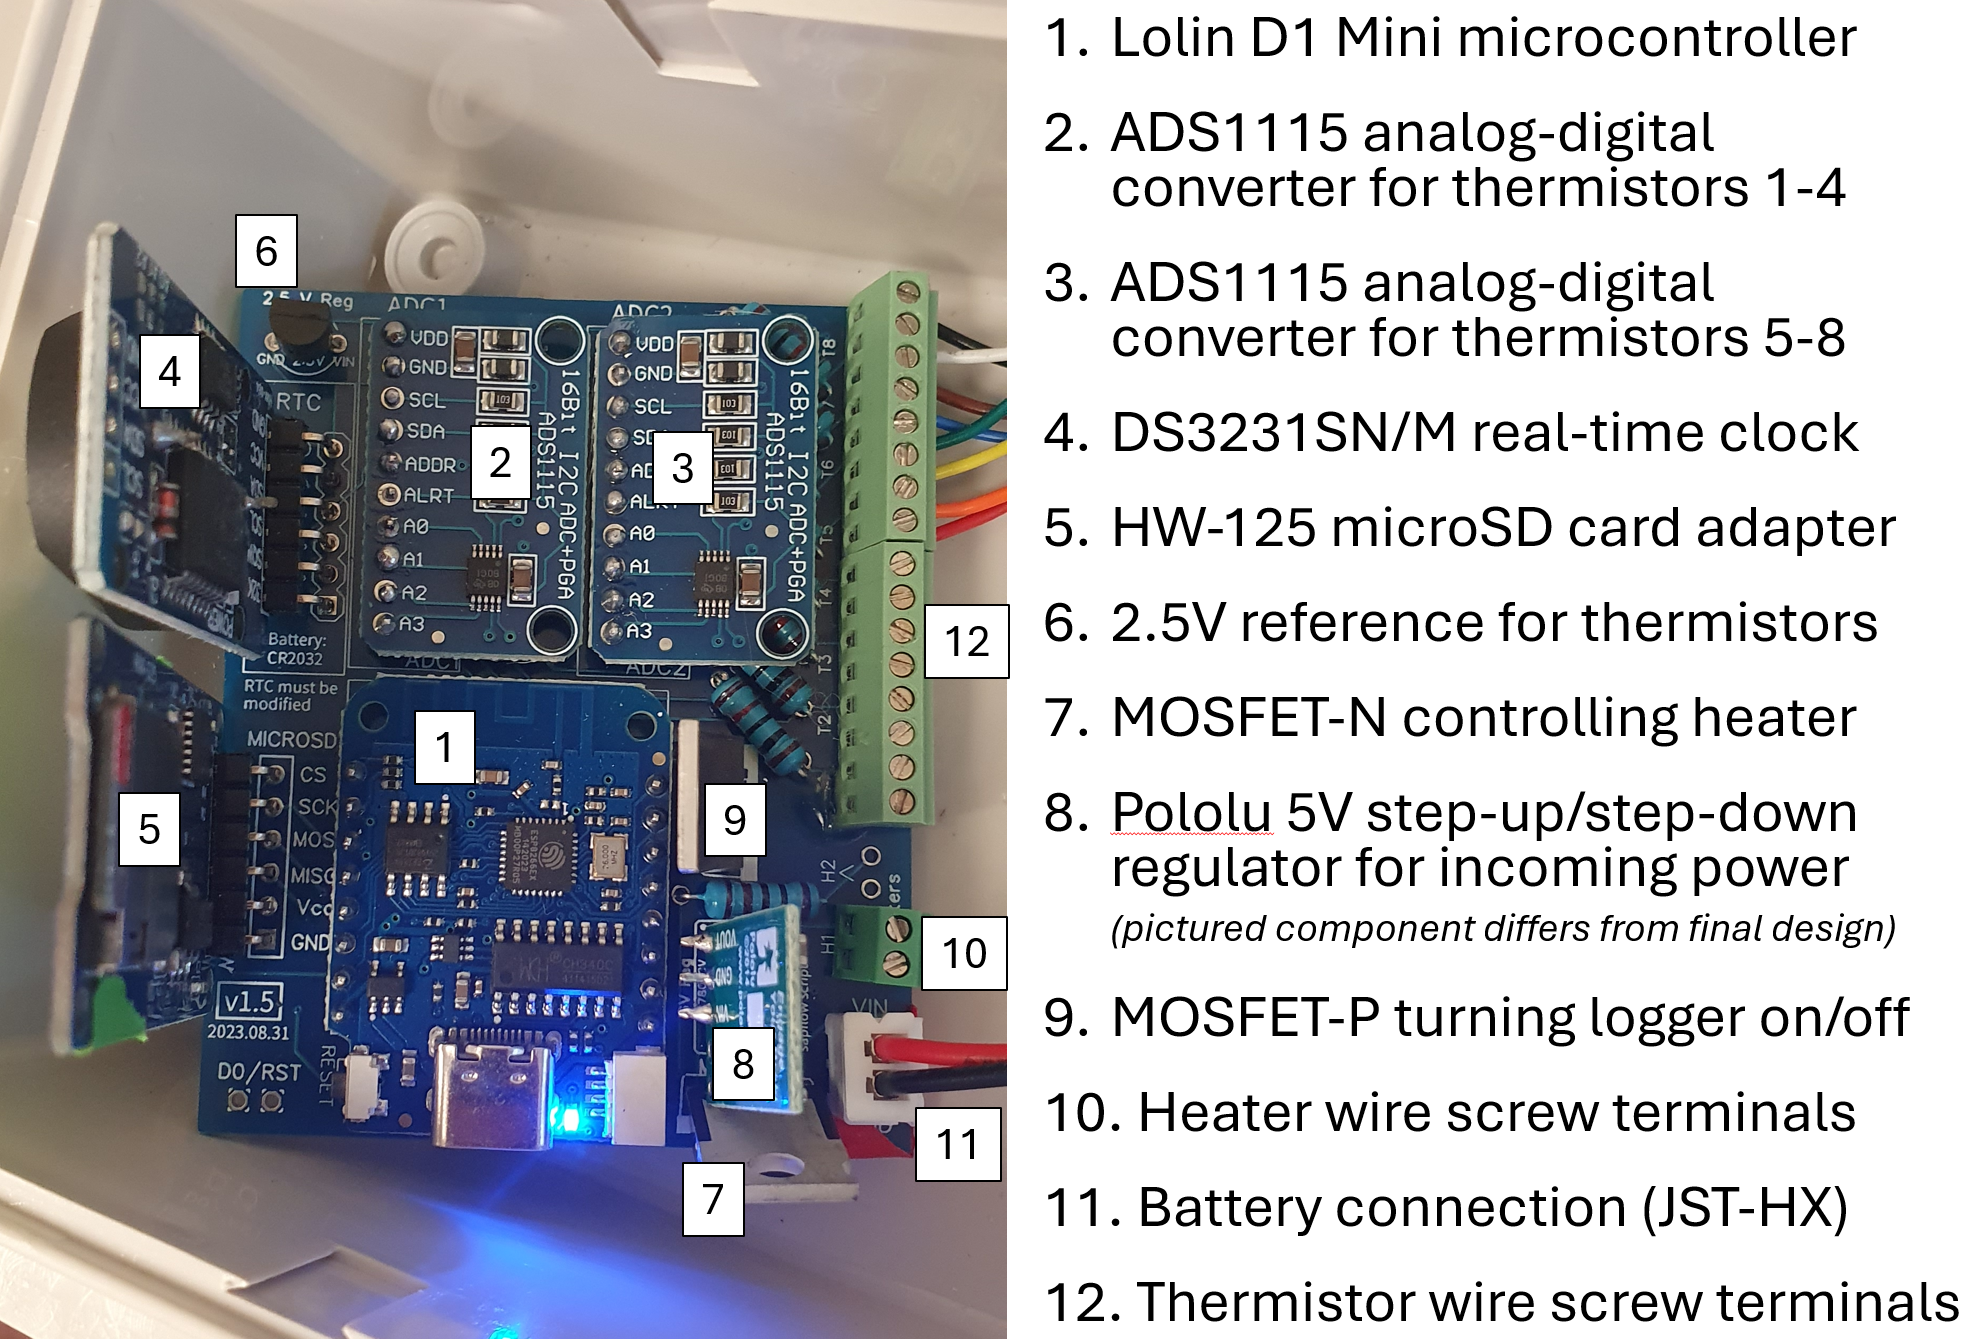
The Lolin D1 microprocessor, ADCs, RTC, microSD adapter, and 5V regulator are in effect their own tiny PCBs that attach to the data logger PCB with metal legs. These legs usually have to be soldered onto these breakout boards first.
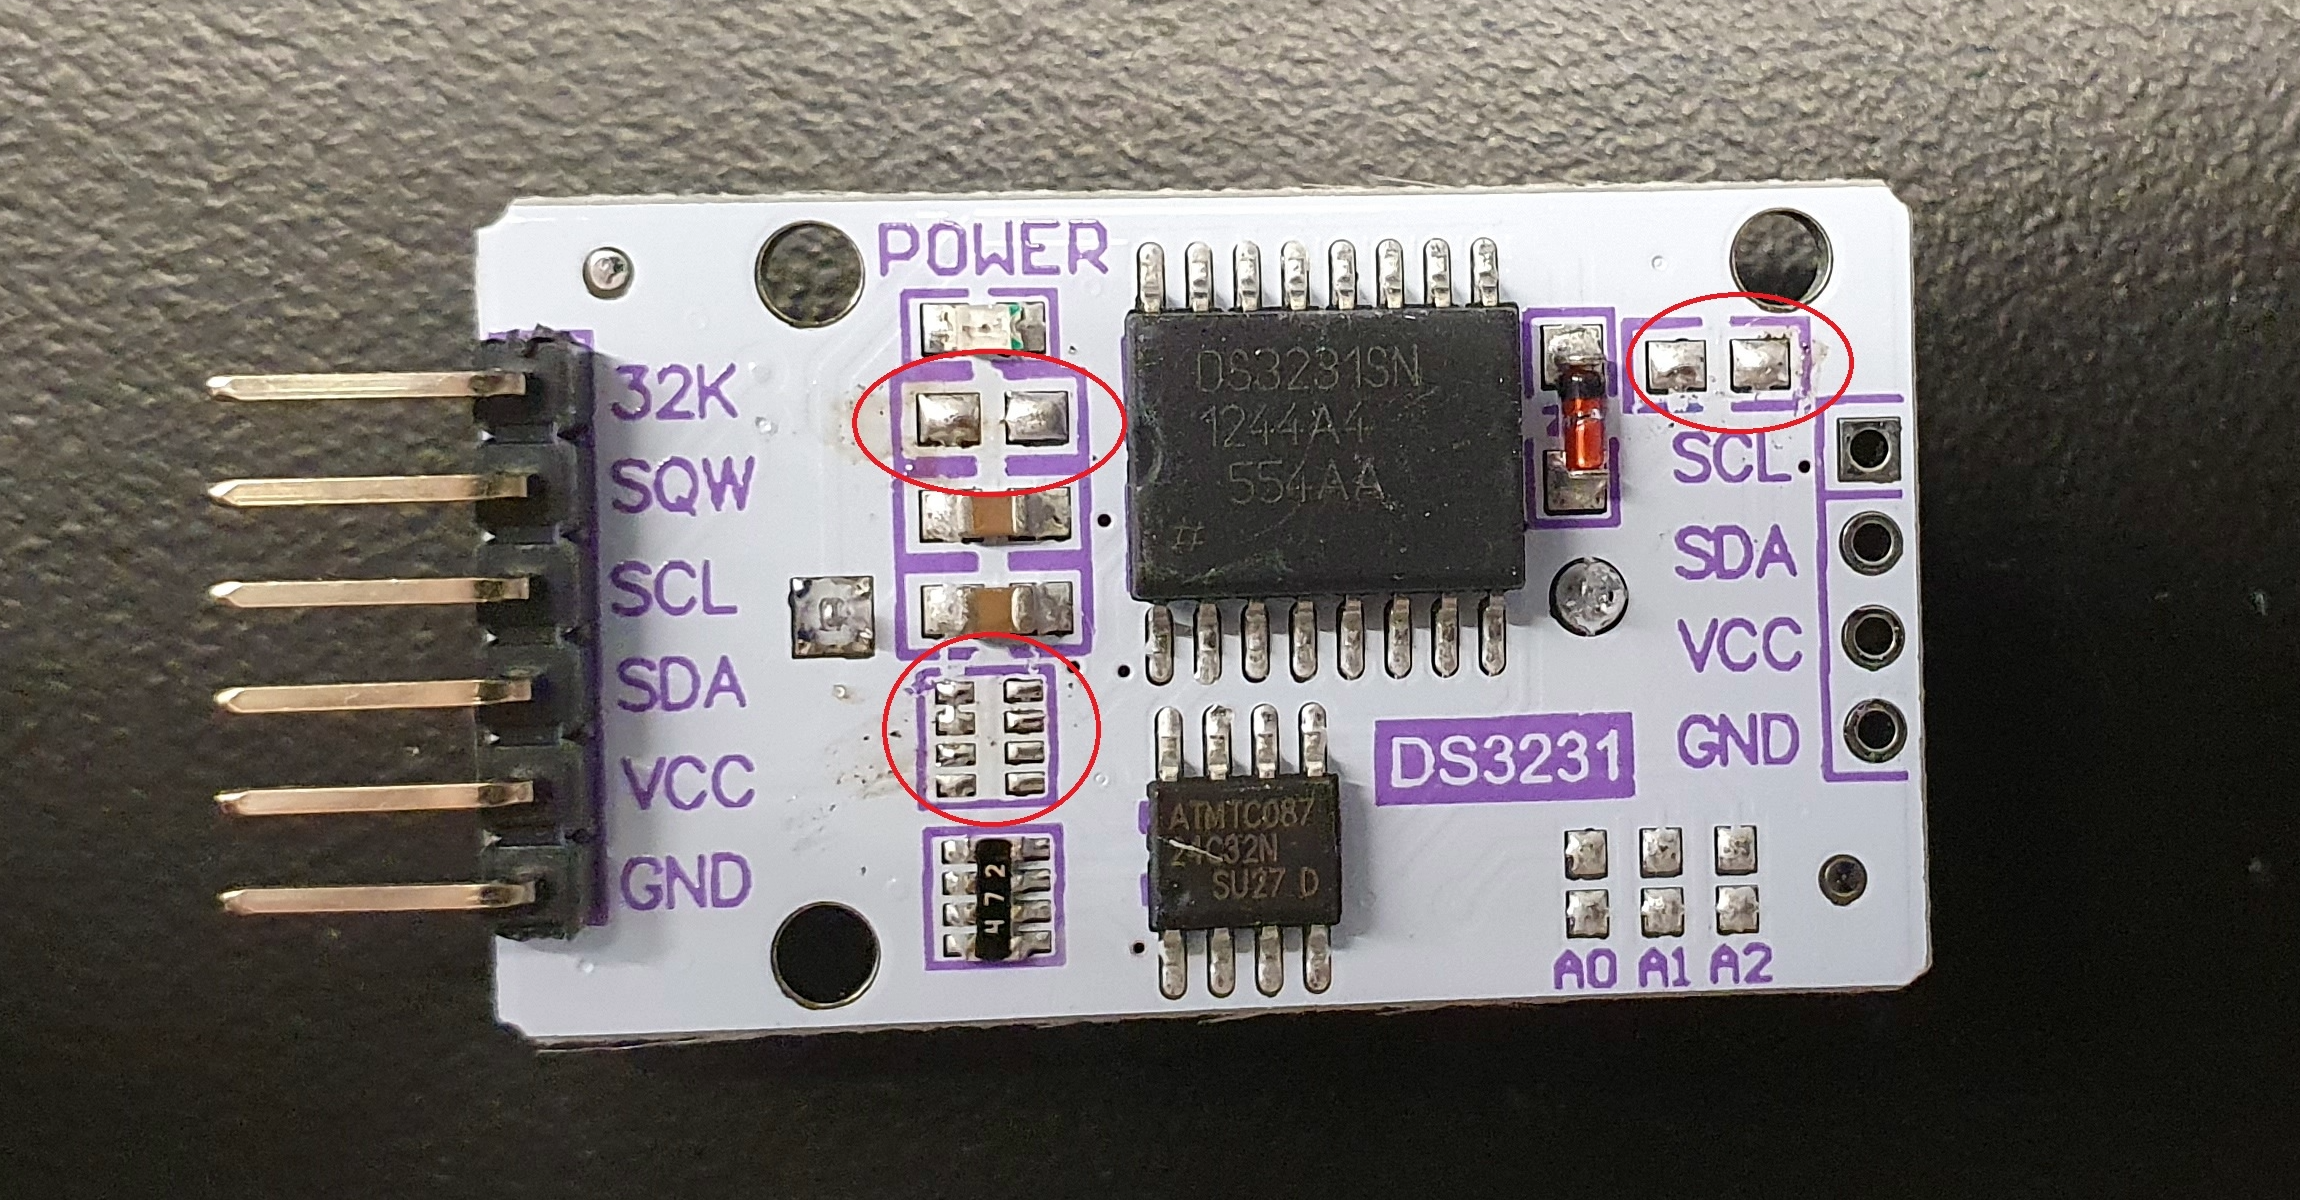
The RTC module also needs to have three little surface-mounted components removed in order to disable its battery charging circuit. The picture below shows what you need to carefully desolder. For the lower component with eight pads, try not to leave any residual solder bridging the pads. Sometimes that causes the RTC to malfunction.
Step 2: The breadboard test
Perhaps as a consequence of using knock-off breakout boards from Amazon, I find that they will frequently refuse to play nicely with one another. This rarely appears to be due to a single totally faulty chip, but rather the combination of all the parts--swapping an ADC out may suddenly allow the logger to run, and that ADC may work just fine with another set of components.
So rather than soldering a whole bunch of data loggers and then finding that many of them don't work, I HIGHLY recommend using a breadboard to verify each set of breakout boards works together before soldering them onto a PCB.
To do this, use a breadboard and jumper wires to replicate the circuitry of the data logger. You can populate the breadboard with the "dumb" components (resistors, MOSFETs, regulators) without bothering to change them every time. You also don't need to replicate all the heaters and thermistors unless you want to ensure the ADCs read the temperature data properly (I found it rare that an ADC failed this test and so generally didn't bother). Prepare one of your batteries of choice to power the breadboard. Finally, put in a complete set of breakout boards that you've soldered the legs onto (and put a microSD card in the adapter), and have some swappable spares on-hand.
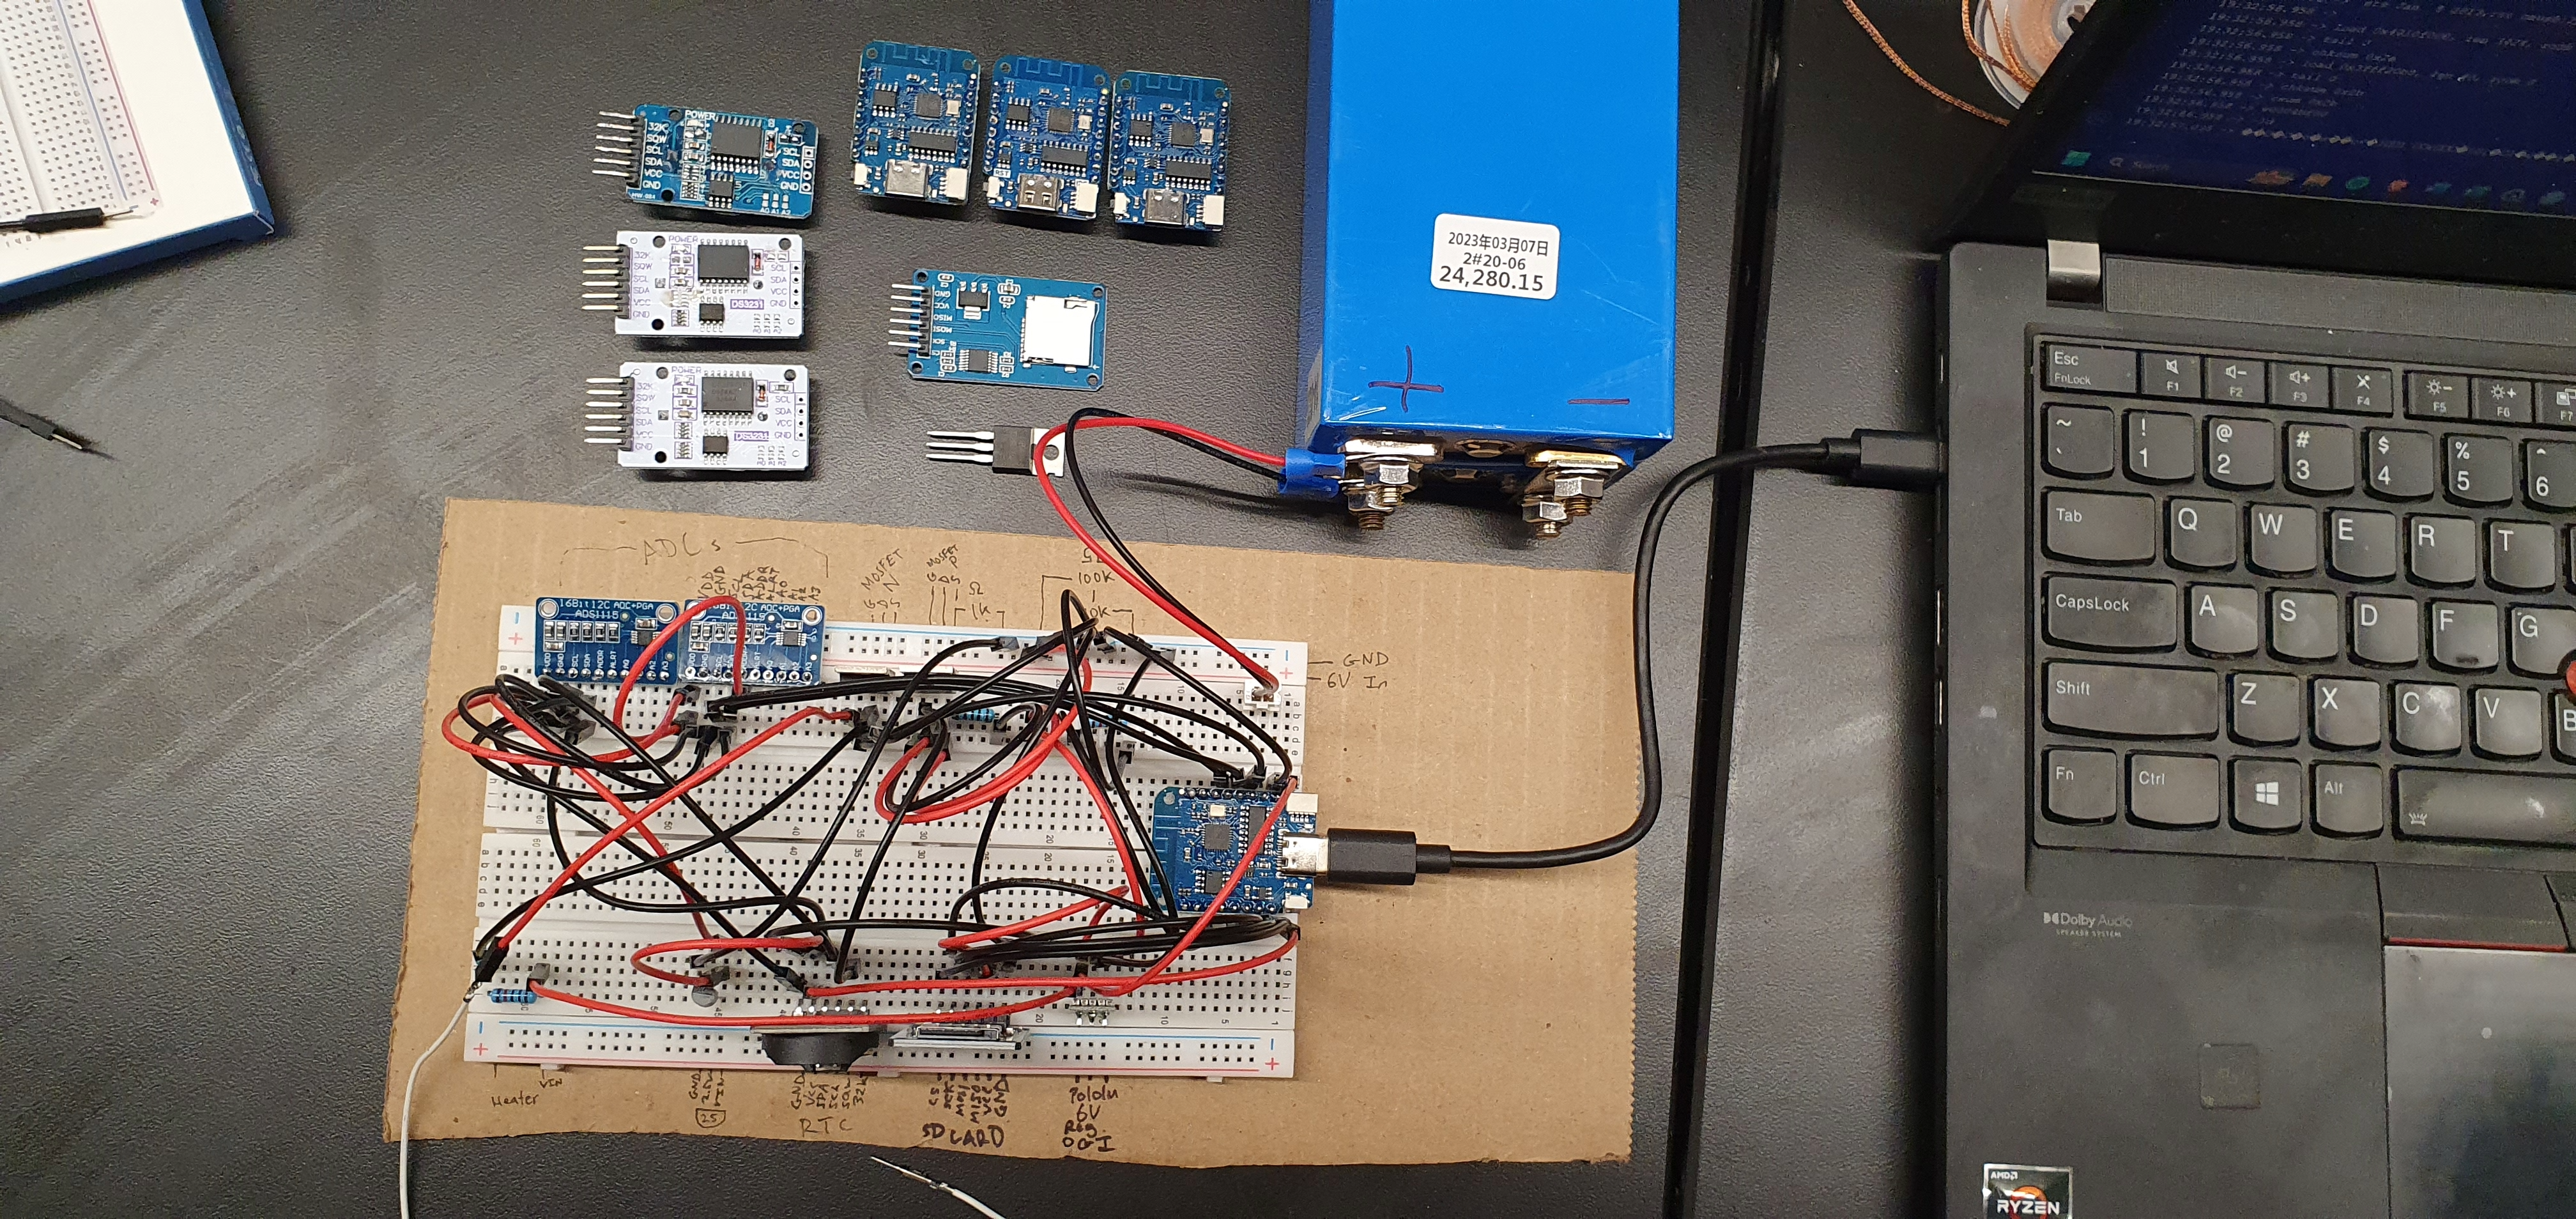
Once you've got your breadboard set up, you'll go through the motions of programming the simulated data logger via USB-C, first uploading the clock set up script, verifying that it works, and then uploading a test script. Please scroll to the "Programming the Sensor" section below for more information, and note that your breadboard will need a jumper wire that replicates the "reprogramming bridge" from D3 to GND discussed there.
If your breadboarded parts are programmed succsessfully, show the expected LED light behavior when powered by a 6V battery, and write data to the SD card, then you're ready to go! Remove your breakout boards, noting which ADC was "ADC1" and which was "ADC2" on the breadboard, and proceed to the soldering.
Step 3: Soldering the data logger
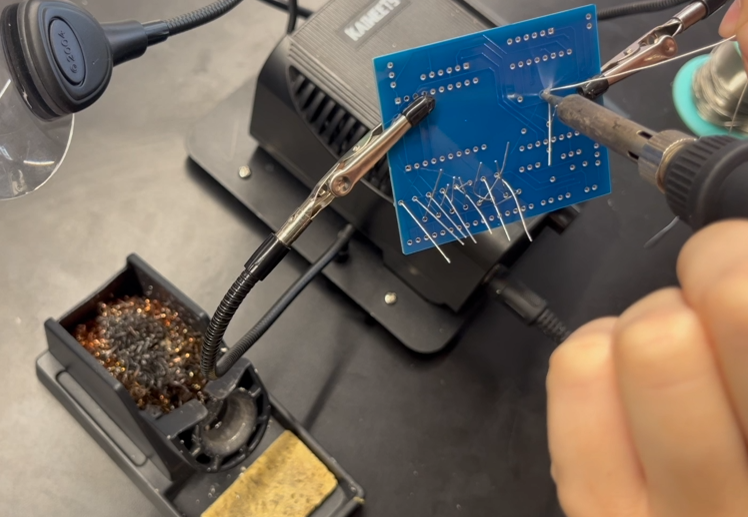
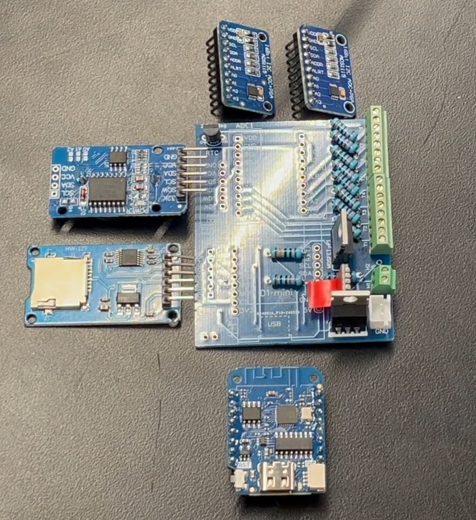
To build the data loggers, I recommend soldering in the following order (lowest components to tallest components, so they can be rested stably upside-down against the table):
- All resistors
- Both ADCs (use them in the same roles that they were breadboarded in!)
- Lolin D1 Mini
- Battery connecter terminal (white; check orientation!)
- All wire terminal blocks
- 2.5v regulator
- Both MOSFETs (see note about orientation stenciling above)
- 5v regulator (Tip: trim the horizontal leads from the 90-degree riser after you solder it to the regulator or orient them away from the exposed pins of the D1 mini to avoid accidental shorts)
- RTC module (must be modified first, see below)
- MicroSD module
Trim wire leads as needed to avoid shorts and make assembly easier, and regularly consult the PCB's etchings to make sure you're orienting things the right way.
Heater and thermistor probes
Required tools/supplies:
- Soldering iron
- Wire strippers (as fine as 24 AWG)
- Superglue
- Digital calipers
- Disposable luer-slip syringes
- Plastic mixing trays
- Gloves
- Lighter
- Heat gun
- Drying oven
Recommended tools/supplies:
- Digital multimeter, preferable with alligator clips
- Superglue accelerant
- Soldering station with "helping hands"
Step 1: Assembling the thermistor probes
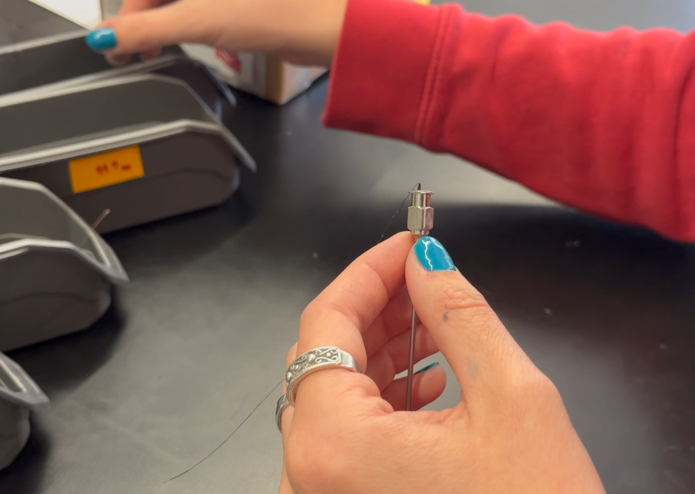
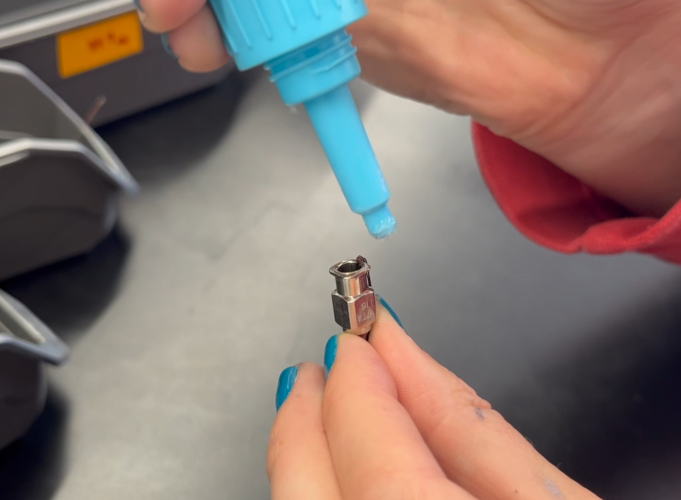
(Note: my pictures for the probe assembly sections are somewhat lacking; I recommend you watch the video above and check out Beslity et al. (2022).)
To measure sap flux at multiple depths in the stem, you'll want to space the four thermistors throughout the steel needle. You can choose how you'll distribute them, but in any case, you'll want to make a sharp bend in their lead wires that tells you exactly how far to insert them in the needle.
To do that, you'll need to make some measurements. I found that my 2 and 4-inch needles had a "base" section, or widened parts that would remain outside the tree trunk, that were 17.2 mm long. My North Star Sensors thermistors had "heads" that were 3.3 mm long. So if I wanted to have my four thermistors centered at depths of 5, 18, 31, and 44 mm inside the trunk, I would need to measure 17.2 mm from the base of the thermistor "head", then add the desired depth, then subtract 1.65 mm. So I would need to precisely measure 20.55, 33.55, 46.55, and 59.55 mm from the thermistor heads and make a sharp bend in their lead wires.
By bending the thermistor wires in this way, you can easily thread them into the base of the steel needle and have them rest at the appropriate depth. Start with the longest "deepest" thermistor. Once all four are at rest with their bends on the rim of the needle base, gently squeeze a dot of superglue onto the outer rim of the base to hold them in place (try to avoid clogging the middle of the needle up). Use some accelerant to cure the superglue.
Step 2: Assembling the heater probe
The heater probe should contain a known length of heater wire with known resistance so that the entire length of the needle is heated evenly during the heat pulse. For 2 and 4-inch probes, doubling the heater wire up three times (such that every part of the needle has four strands running through it) and having the leads stick 1-2 inches out of the needle base resulted in resistances of ~12 and ~20 ohms, respectively. Once you fold the wire and insert it into the probe, use a dab of super glue to hold the leads in place (as with the thermistor probes).
With the 5 V output of my data loggers, I found these configurations to emit satisfactory amounts of heat, although the 2-inch probes may have produced better signals because more heat was put out. Because V=IR and Q=I^2*R*t, more resistance in the heater results in less current and therefore much less heat. But if resistance is too low, as in a 1-inch probe with heater wire doubled up three times, you risk heating up the wire so much that it melts and breaks the circuit. You can always adjust the heat output by changing the number of times you double up the heater wire, or by changing the duration of the heat pulse, although excessively long heat pulses may causes departures from heat pulse theory.
Step 3: Epoxying the probes
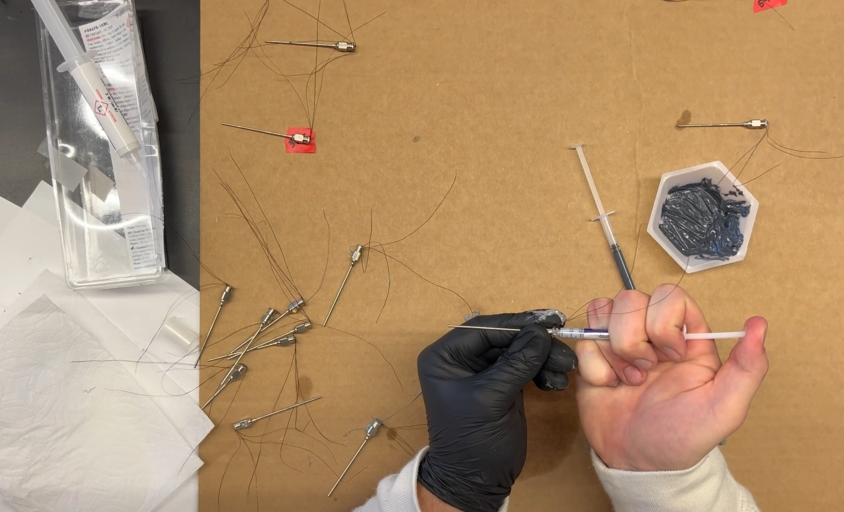
Now that you have your probes assembled, it's time to fill them with thermally conductive compounds and epoxy them in place. For the original Js5 design, the authors used a thermally conductive epoxy to fill the entirety of the needle before heating and curing it. Perhaps because I used a different epoxy, I found it pretty difficult to completely fill the needles--we could do it, but would waste a lot of epoxy in the process.
For the majority of the probes I've built, I pivoted to using thermally conductive (and electrically nonconductive) grease with much lower viscosity to fill the majority of the needle, and then injected a smaller amount of thermal epoxy to hold everything in place. The thermal greases I used can be purchased in great quantities, pre-loaded in luer-slip syringes, for cheap from Amazon (they're often marketed as thermal paste for CPUs). I didn't notice any degradation in reliability or performance, but if you're trying to make everything as robust as possible, I would probably skip the grease and just muscle in the epoxy.
Start by mixing a small batch of thermal epoxy in a plastic tray. Then take a syringe of thermal grease, shove it into the steel needle, and fill it with grease until it flows out of the other end. Then take a disposable syringe and load it with thermal epoxy, then inject it into the needle until a couple cm of the grease comes out the other end. You just want to use enough to fully lock the thermistors in place, preferably by forcing some of the epoxy all the way into the narrow part of the needle.There is some art to this step; get ready to make a mess!
If you're not using grease, just use the epoxy for the entire needle. I also experimented with using grease and then fixing things in place by filling the needle base with superglue; it seemed to work fine but I decided to just keep using the thermal epoxy.
Once you're done, put the needles in a drying oven to cure the epoxy according to the epoxy's temperature/duration guidelines. Don't worry if you got epoxy on the outside of the probe, you can use steel wool to take it off easily once it's cured.
Step 4: Cutting and stripping the cables
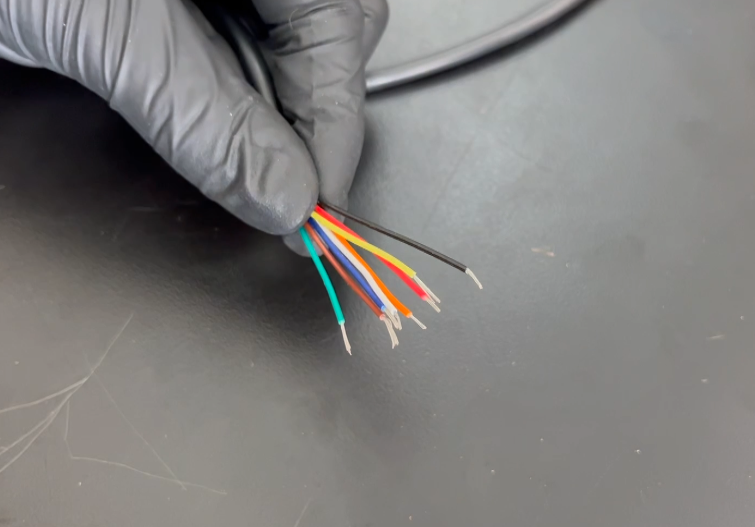
The heater probes use two-conductor cables and the thermistor probes use 8-conductor cables. You'll want to cut them all to about the same length, making them long enough to run the length of your sensor case and give you flexibility in positioning when you install the sensor. I usually aimed for 3-4 feet.
For the ends of the cables that will plug into the data logger, strip off 1-2 inches of the outer cable insulation, and for each individual conductor wire strip off a few mm of insulation. You want enough exposed metal to be securely grabbed by the screw terminals, but not so much that the wires may contact each other and short out.
For the ends of the two-conductor cables that will connect to the heater probes, strip off a couple inches of the outer insulation, and then strip off ~15 mm of insulation from the two inner conductor wires.
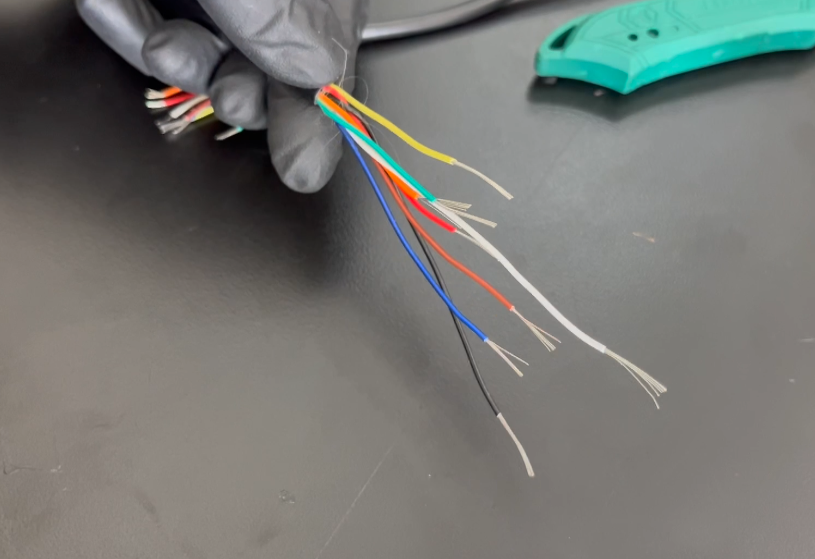
For the ends of the 8-conductor cables that will connect to the thermistor probes, you'll want to strip off several inches of the outer insulation, then trim the wires down to match the staggered lengths of the thermistor leads hanging out of the probes.
My 8-conductor cables had wires colored red, orange, yellow, green, blue, brown, black, and white inside. I paired them up in that order and had the red/orange pair connect to the shallowest thermistor in the tree, and the black/white pair to the deepest thermistor in the tree. The thermistor embedded deepest in the tree will have the shortest thermistor leads sticking out of the needle base, so the black and white wires coming out of the 8-conductor cable should be the longest and the red and orange wires the shortest. Strip all the inner wires' sheaths back by about 15 mm.
Step 5: Soldering the cables
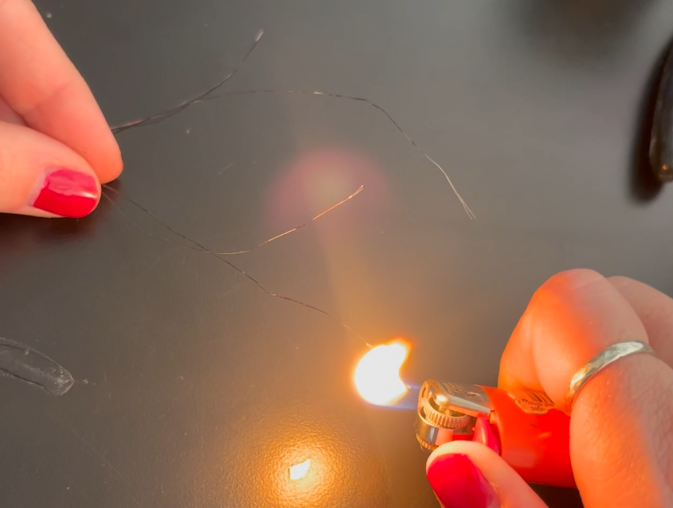
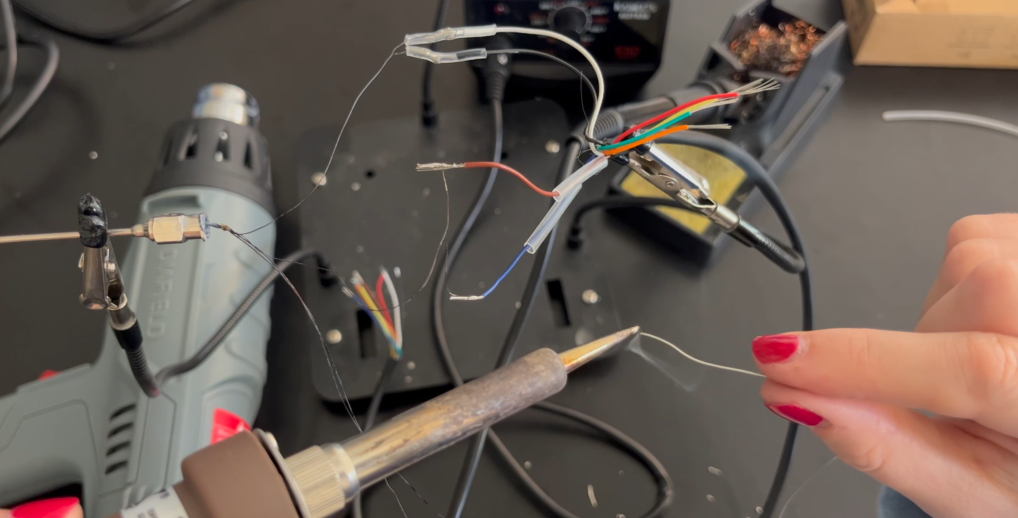
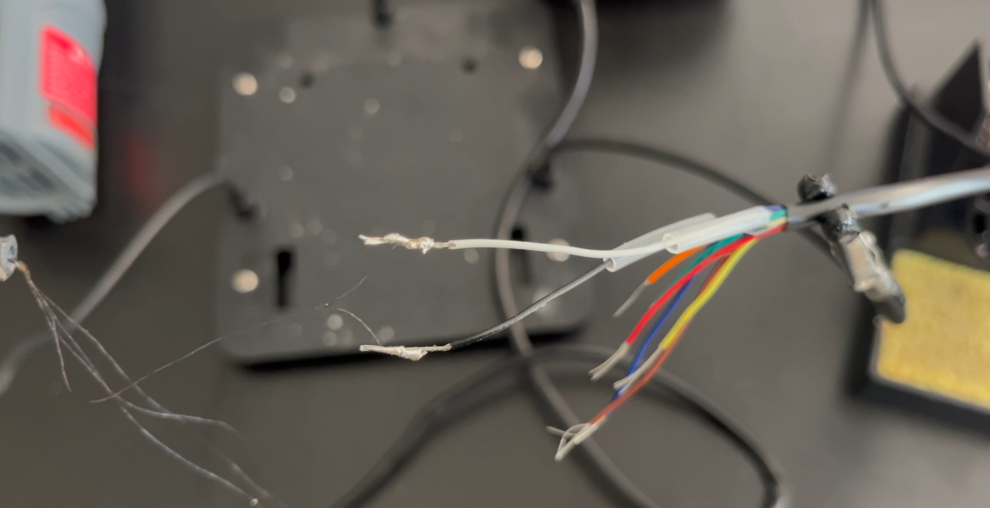
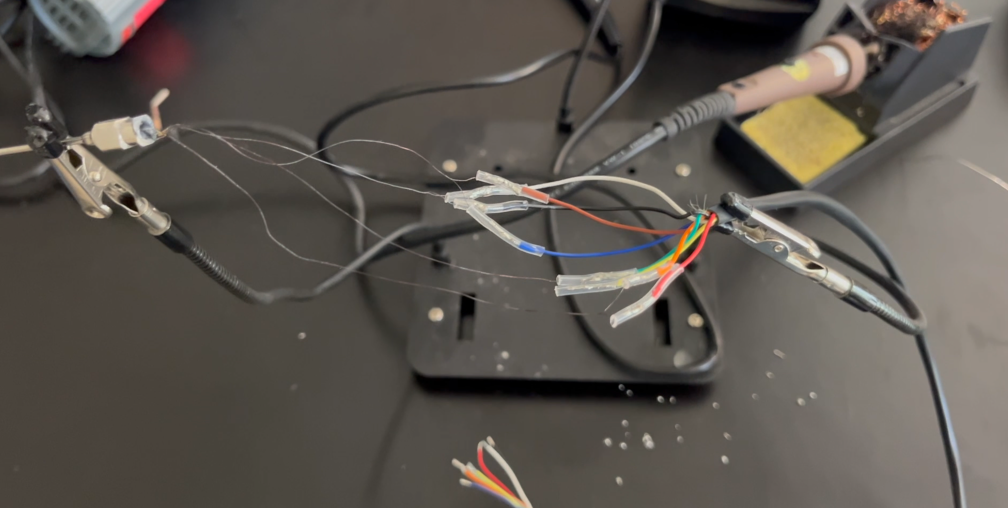
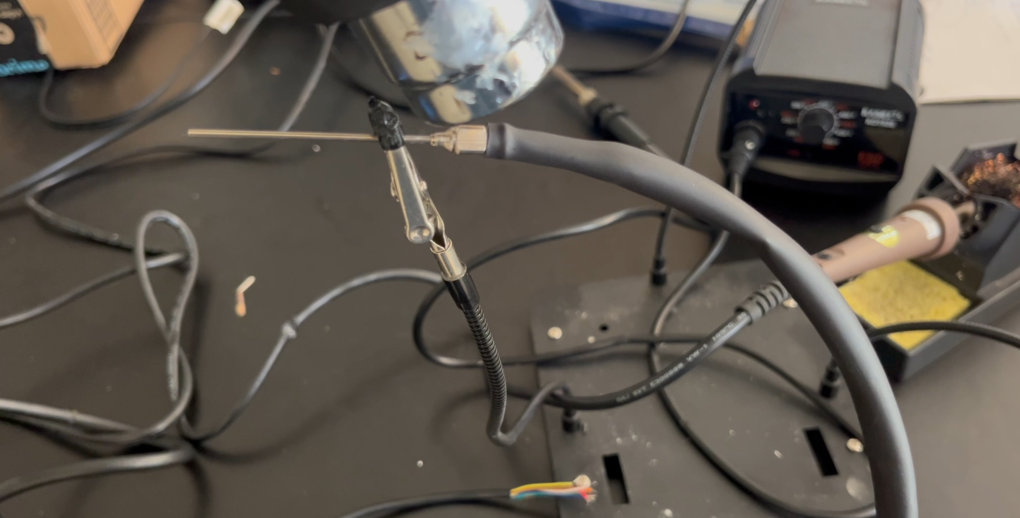
Once the probes are finished curing, you'll need to solder them to the stripped cables. You'll need to start by burning some of the super-thin insulation off of the super-thin thermistor leads and heater wire--just a couple cm worth. For the thermistors, peel the leads apart for a few inches before burning, so that the insulation is sure to remain intact where the leads are touching.
Next, take some of the 1/16" clear heat-shrunk tubing and cut eighteen 2 cm segments off of it. Slide these segments onto every conductor wire of the cables (they will later be slid over the solder connections to the probes).
Here I find it very helpful to use a "helping hands" soldering stand. Put the probe in one clamp and the cable in another. Take the thin wire leads from the thermistors/heater wire and carefully wrap the metal wire exposed by the burning around the stripped conductor wire from the cable.
I found it difficult to solder the tiny thermistor/heater leads to the conductor wire, but had the best results by heating the metal up with the iron and then adding solder to it. Make sure the solder covers the wires well. I also found that after some of the solder flux burned off and the solder was less runny, I could "smear" some of it with the soldering iron to create a blob of hardened solder that fully covered part of the thin lead wires, which seemed to me like it would form a stronger connection.
After soldering any pair of lead wires (be they thermistor leads or ends of the heater wire), I use the multimeter to test the entire probe unit at the points where the cable plugs into the data logger. Thermistors should read around 8k to 11k ohms (but can be lower if they got hot from the soldering). The heater wire should read around 10 to 13 ohms for a 2-inch probe, or more like 20 ohms for a 4-inch probe (it also depends on how long your heater wire leads were). If the values seem inconsistent or off by a significant degree, try re-doing the soldering.
If the resistance values look good, slide the tiny clear heat shrink segments over the just-soldered exposed metal bits. Use a heat gun to shrink them down, making sure all exposed metal is covered. If any exposed metal remains, or the heat shrink already shrank during soldering and you can't slide it down the wire, or you forgot to put heat shrink on in the first place, use some electrical tape to cover up all the exposed metal.
Now it's time to put the outer layer of environmental protection on the probes. Cut a generous length of 3/8" heat shrink tubing that can begin at the base of the steel needle, fully cover the exposed wiring, and overlap the intact cable for several inches. Slide it on, starting on the data logger-end of the cable, and heat shrink the ends, taking care to keep the needle from capsizing as the sheathing shrinks. I like to leave the middle section of the heat-shrink tubing unshrunk, as it leaves the probe more flexible and allows one to make repairs to the wires inside by cutting the tubing open.
You can test all the wire ends with the multimeter again now (and at any time in the process) to be safe.
Assembling the sensor
Required tools:
- Wire terminal ratchet crimper
- Pliers for tightening battery terminal nuts
- Super glue
- O-ring grease
- Cordless drill with step-drill bit for drilling plastic
- Small flathead screwdriver
Recommended tools:
- Super glue accelerant
Step 1: Assembling the battery pack
Using the 20 cm wires from the JST wire set, install a male JST plug on one red and one black wire (be mindful of which one will lead to Vin and which one will lead to GND! I think my design actually did it reverse of convention, but you could do it the "right" way by flipping the orientation of the JST connector on the board and swapping the polarity of the male connector...just be careful if following my pictures).
On the other ends of these wires, crimp ring bolts to the stripped wires. Tip: double the wires up on themselves to give the crimp more material to hold onto. But don’t reduce the length of the wire by too much—it’s a pretty tight fit already from the battery leads (positioned at the bottom of the case to separate them from the dataloggers) up to the white plug in the corner of the logger.
So at this point you should have a pair of wires, red and black, with a white male JST connector on one end and two metal rings on the other end. Now, assemble a battery pack using two of the LiFePO4 batteries and an included battery bar + two nuts. Make sure you’re connecting them in series. Attach the wire rings from step 1 to the remaining two battery terminals, being mindful of polarity, with the other two nuts. None of these nuts needs to be super tight, but I use pliers to turn them a bit--just be careful not to short the battery with the pliers, or sparks will fly!
Step 2: Final assembly inside the case
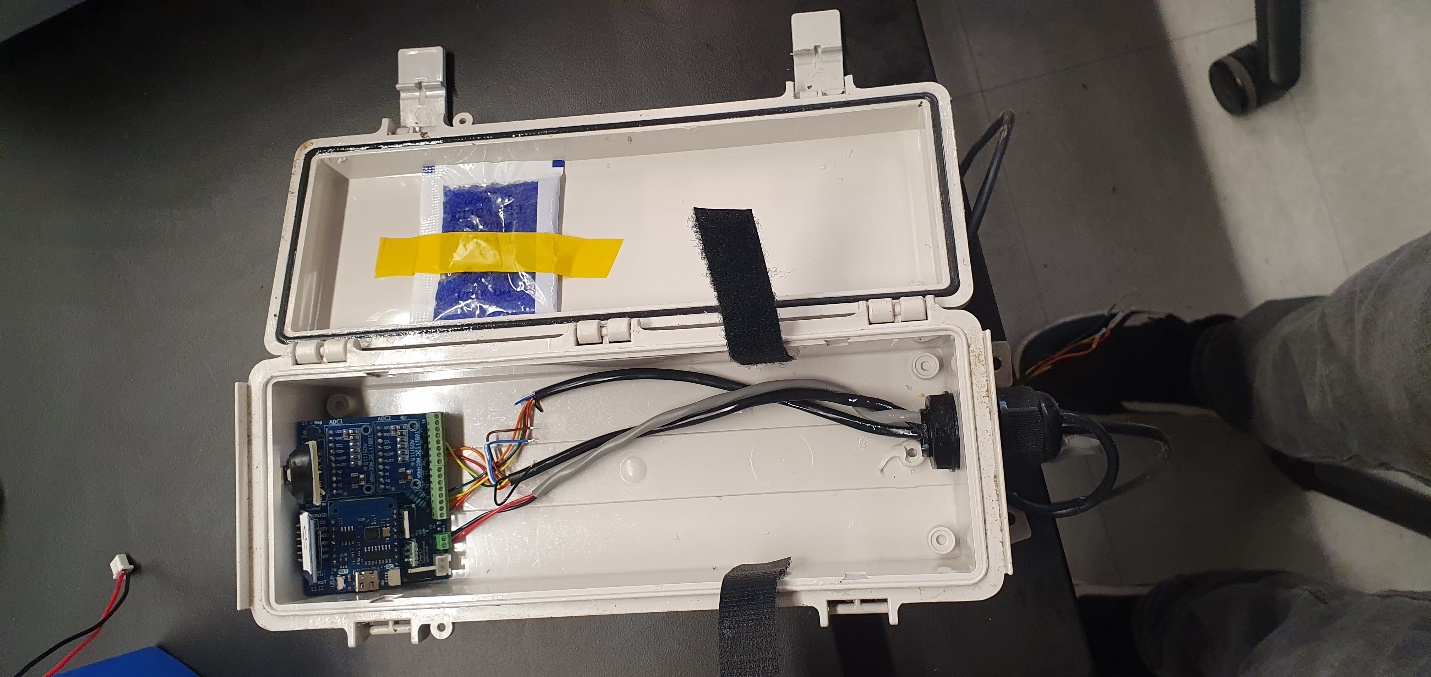
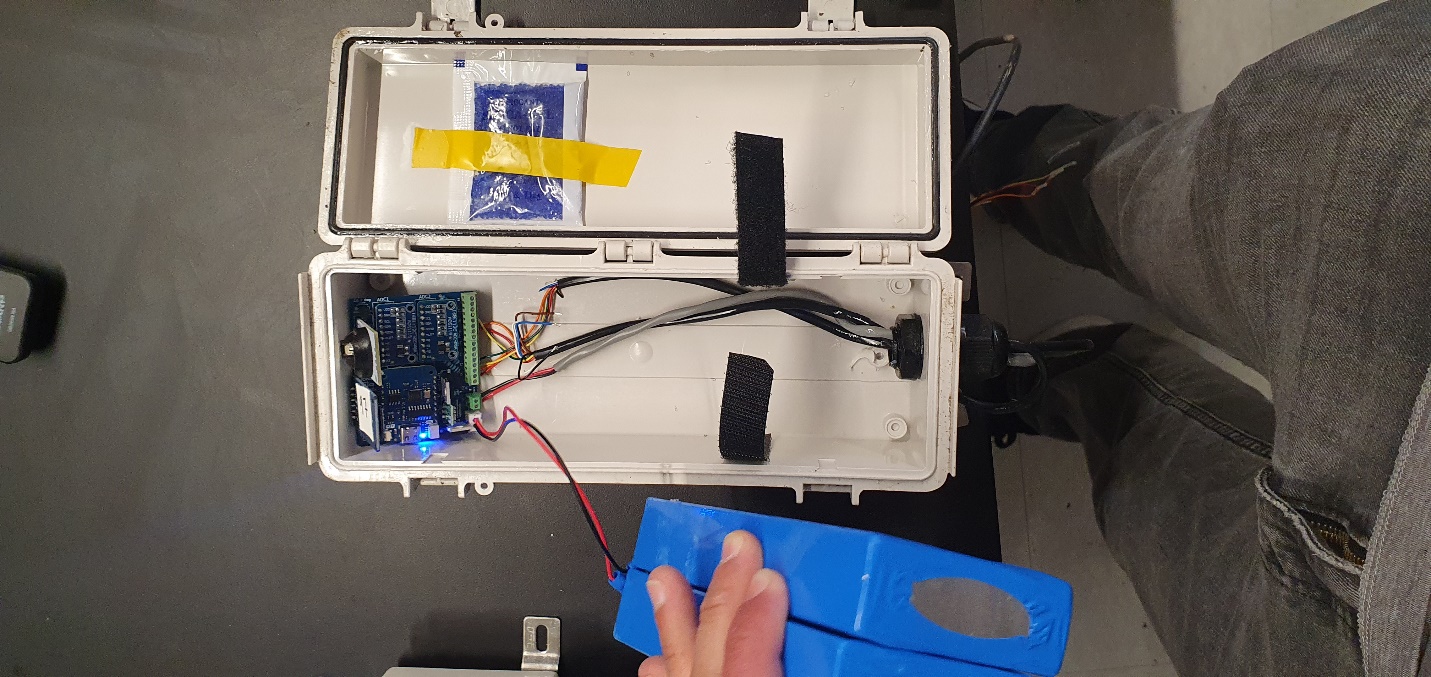
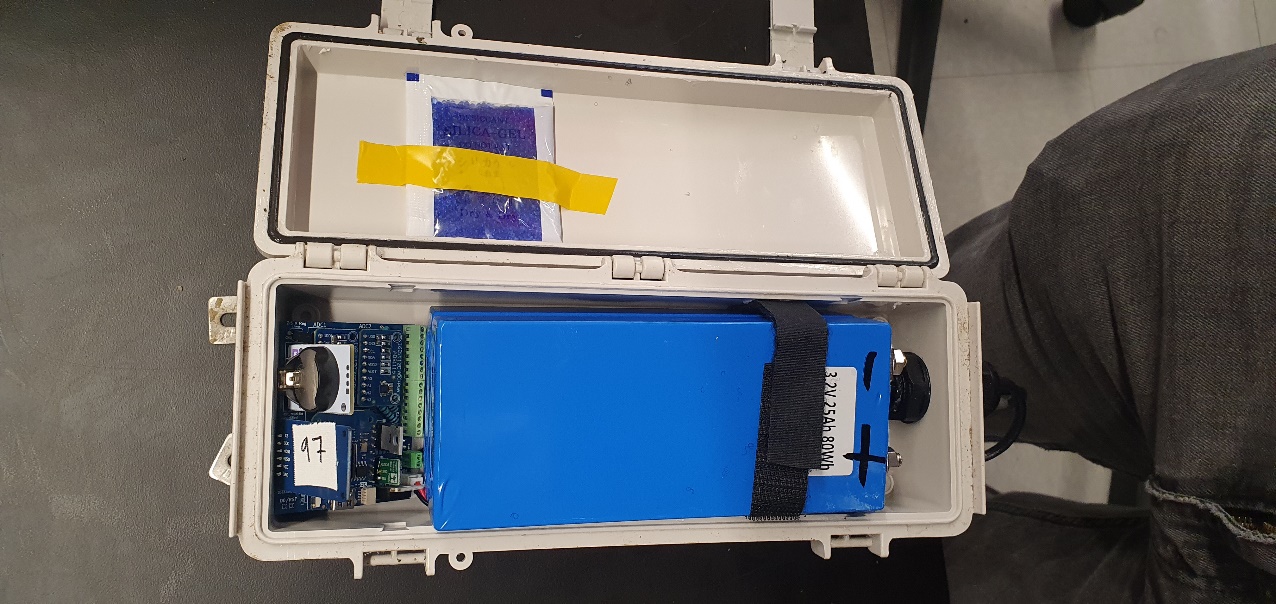
Now we turn our attention to the waterproof case. My design situates the data logger at the top of the case (so any water that intrudes rests far away at the bottom of the case), runs the cables from the data logger to the bottom of the case along the back wall (behind where the battery will sit), and then has them exit the case through a waterproof cable gland at the bottom the case (to face away from rainfall). Decide which end of the box will be the bottom.
Glue some velcro straps into the interior sides of the case where the battery will sit (see pictures). This will allow you to open the sensor while it’s installed on a tree without everything falling out.
Next, disassemble one of the cable glands and figure out which section goes through the case well. Then drill a hole in the bottom of the box using a plastic step-drill. It should be just big enough for the cable gland, so go step by step and stop frequently to see if the gland will fit into the hole.
Install the gland with a generous amount of O-ring grease on all its surfaces, including the inner surfaces of the rubber piece with three holes. The grease is critical to prevent water intrusion. Then run all three cables through the cable gland’s holes, making sure grease soaks generously through all the holes.
Then insert the heater wires into the 2-hole wire terminal block and screw them in. Polarity does not matter. Next you'll screw in the sixteen rainbow colored wires. Each probe leads into one of the 8-hole terminal blocks, and I recommend sticking with a consistent color order for each one (e.g. red, orange, yellow, green, blue, brown, black, white). Technically, each pair of colors can have their positions swapped as polarity for each individual thermistor does not matter (e.g. red-orange could be orange-red). The way my code currently works, the wire terminal block closer to the center of the datalogger is the bottom (upstream) probe (T1-T4) and the other block is the upper (downstream) probe (T5-T8). Mark the bottom (upstream) probe with some tape after you screw all the wires in so it’s easy to keep track of. Make sure that no stray wire strands are escaping from the wire terminal blocks and potentially causing shorts.
Once everything is screwed in, move the cables around in the gland until the data logger rests comfortably on the upper end of the case. To put the battery in, I recommend first plugging it into the data logger and then maneuvering it into the case with the battery terminals facing down (away from the logger) and the battery wires running up the side of the case closest to the white battery connection on the data logger. It may seem tight, but it should fit. Velcro the battery in, verify the case can close, tape a desiccant pack to the inside of the door where it will not interfere with the velcro, clean and apply O-ring grease to the rubber gasket around the box door, and tighten the cable gland--you're done!
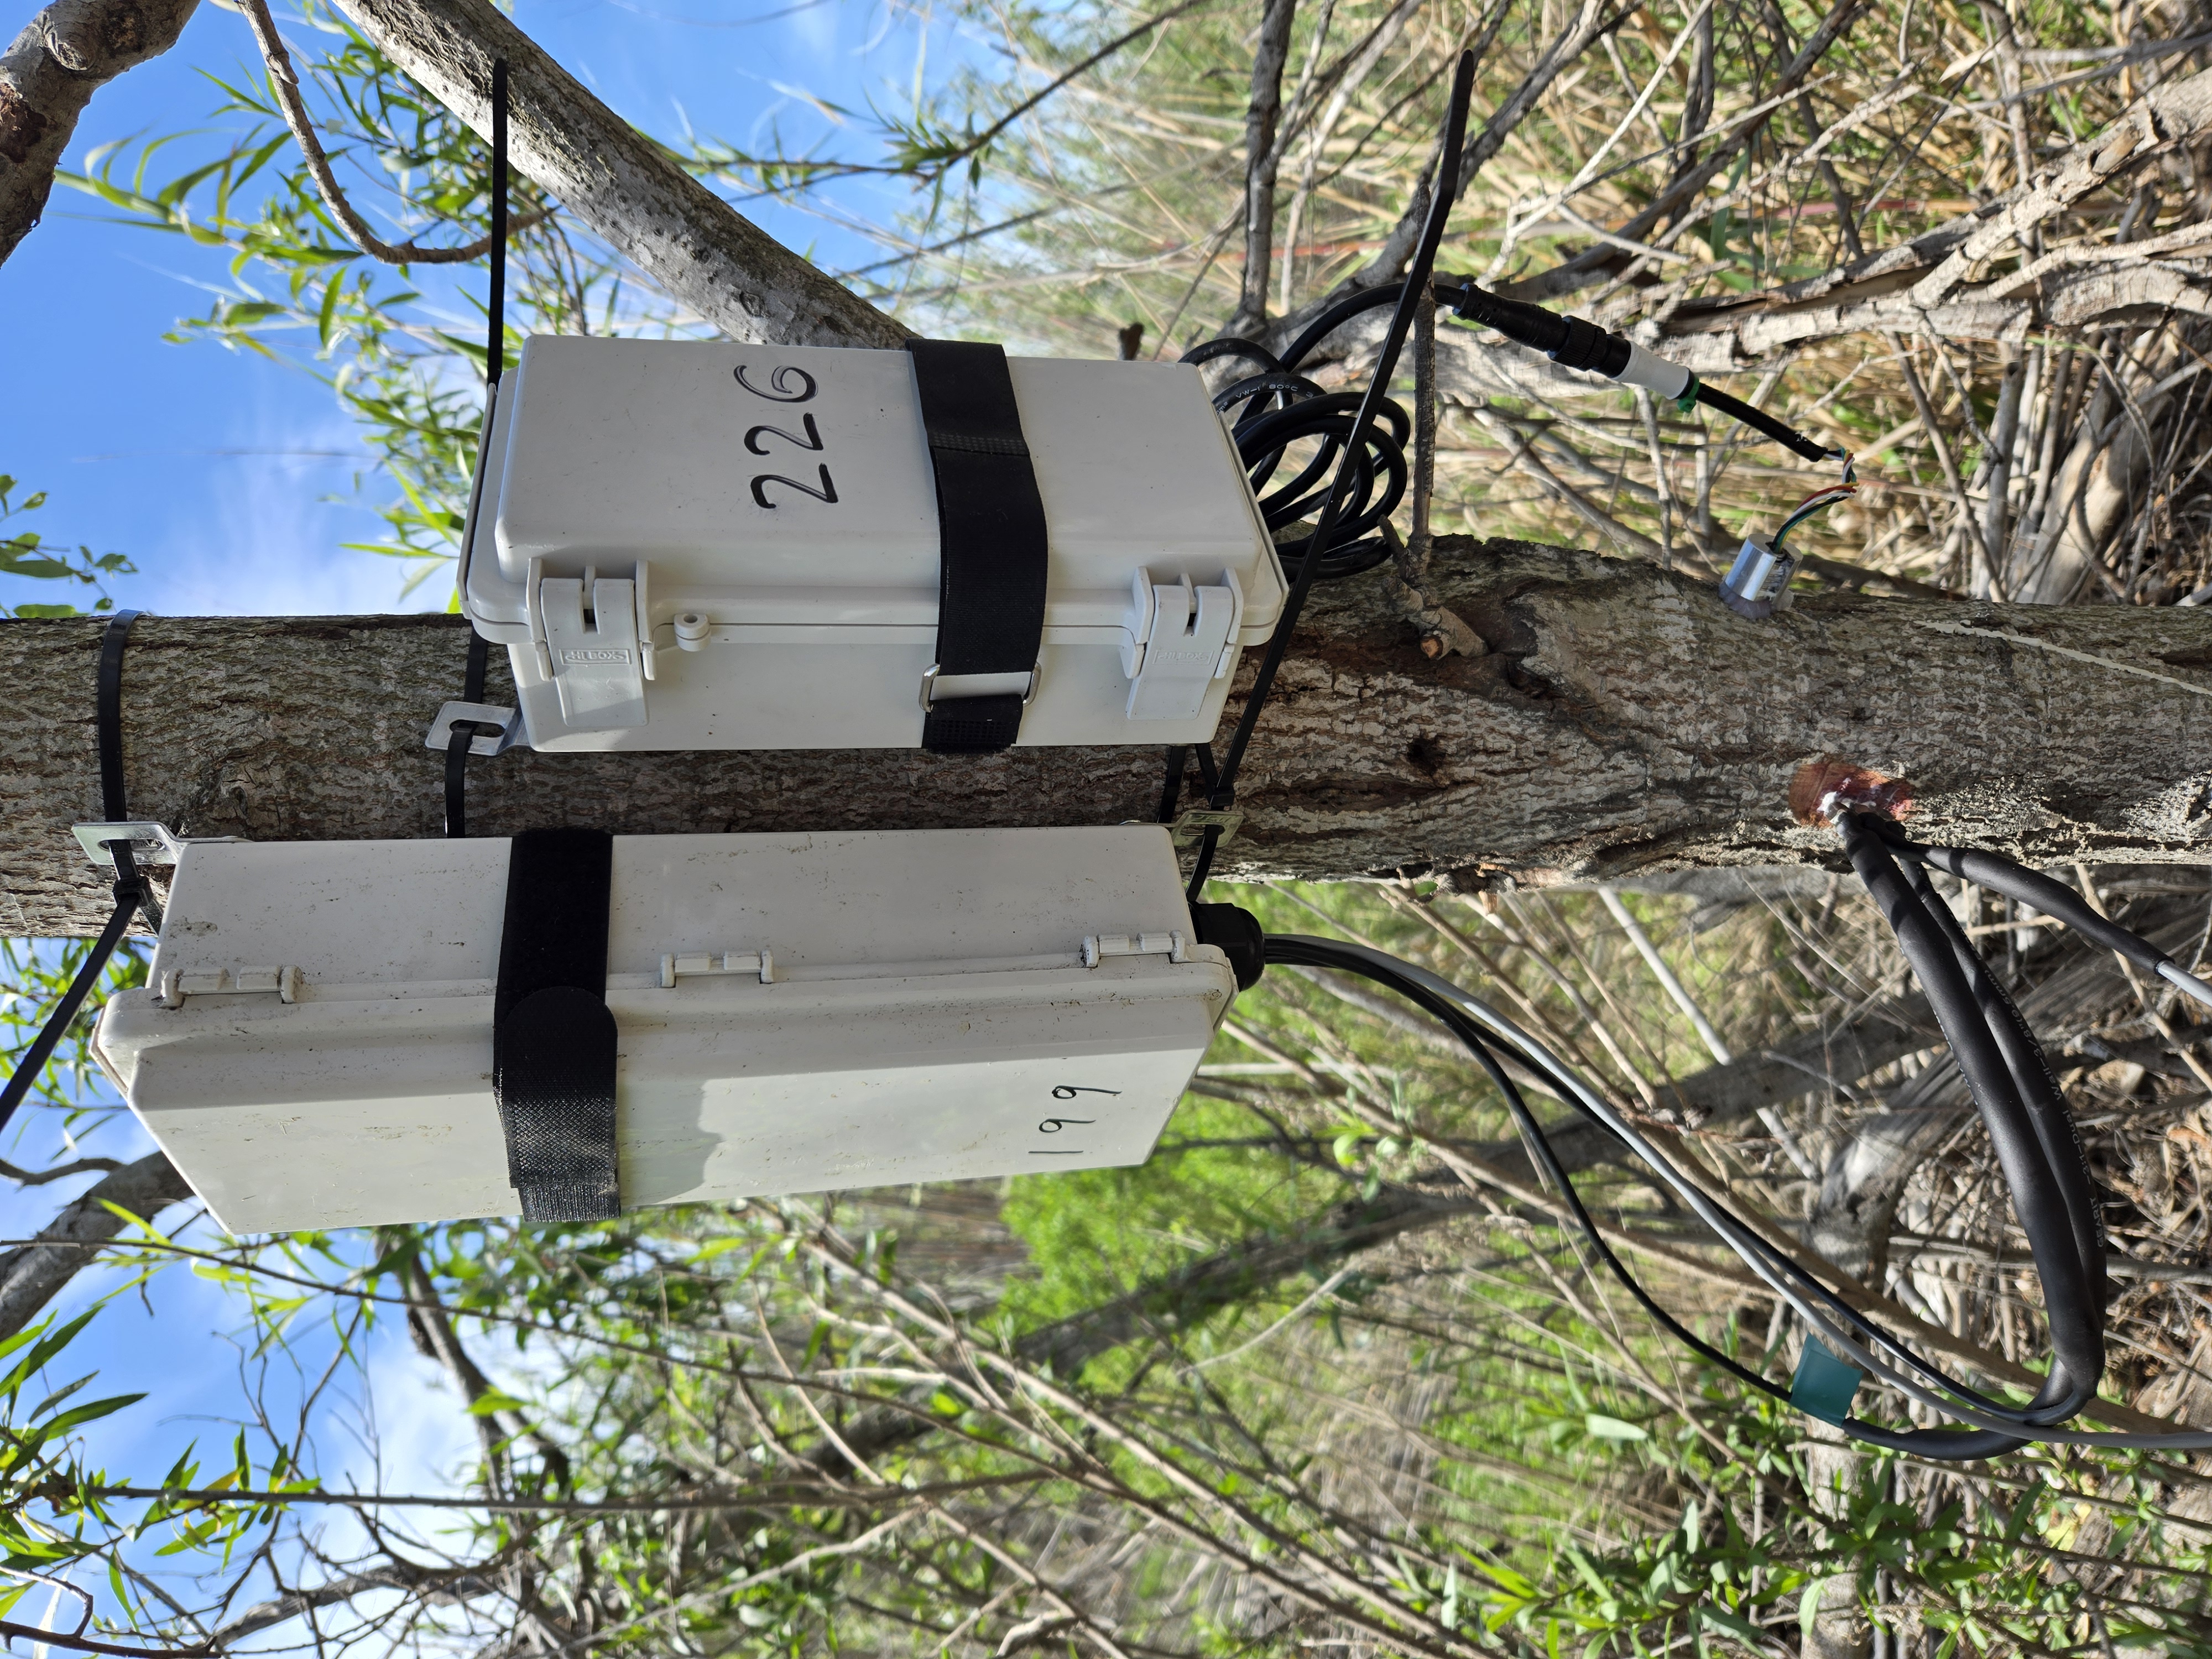
I recommend tightly strapping the 18-inch velcro cinch strap around the box for extra security. Make sure the strap is oriented so that when the box is on a tree, the strap can be undone and the data logger accessed.
Programming the sensor
Required tools:
- Computer with ArduinoIDE
- USB-C data cable
- MicroSD card reader
- Male-to-male breadboard jumper cable
Recommended tools:
- Thermocouple thermometer
WARNING: DO NOT PLUG IN BATTERY AND USB CORD AT THE SAME TIME!
WARNING: HEATERS CAN GET VERY HOT WHEN RUNNING THE BOARD ON USB POWER! UNPLUG HEATERS OR KEEP D1 MINI’s D3 BRIDGED TO GND (use holes by 5V reg) TO PREVENT.
Plug the logger in via USB and set up the Arduino IDE to communicate with it. Note that there are some drivers you need to download; see Beslity et al. (2022) for more information. As of June 2024 some of the links in that paper are out of date, but the appropriate packages and drivers can easily be located with Google. As of now, the URL for the Board Manager is: http://arduino.esp8266.com/stable/package_esp8266com_index.json.
Program the sensor first with the Board_Configuration_SD.ino script. Make sure there is a microSD card and watch battery inserted. After it uploads the script, go to the Serial Monitor and set the baud to 115200. You should see (but with the actual current time of your computer):
Initializing SD card...initialization done.
17:44:49.286 -> Writing to test.txt...done.
17:44:49.328 -> Current time:
17:44:49.328 -> 2024/6/13 (Thursday) 17:44:3
Note: As of April 2025, sometimes an error along the lines of “A fatal error occurred: Timed out waiting for packet header" pops up when uploading a script. This is just a software issue and can be solved by changing the MD5_TIMEOUT_PER_MB value to 60 in esptool.py, which is buried within the Arduino15 folder. See here for more information. On my PC, the file is found at: "C:\Users\swb_1\AppData\Local\Arduino15\packages\esp8266\hardware\esp8266\3.1.2\tools\esptool\esptool.py"
If that worked, use a jumper wire to bridge the two open holes by the 5V regulator, being careful not to touch any other metal on the data logger. This bridges D3 on the D1 Mini to GND, which allows you to upload a second script atop the setup script. Once the jumper wire is inserted, press the D1 Mini’s reset button, and you should see the blue LED flash briefly.
Now upload this test script. Once it’s done, unplug the USB cable, remove the jumper wire, and plug in the battery. You may see the blue LED turn on immediately, or you may need to wait up to two minutes. But if the logger is working correctly, the blue LED will eventually turn on for five seconds, turn off for five seconds, then turn on for ten seconds. This should then occur every minute, making it easy to test the sensor rather than waiting 30 minutes between cycles with the main script.
When you're ready to upload the real measurement script, bridge the D3-GND holes again and upload this script (or a version of it modified to your liking). This script is itself just a crudely modified version of Justin Beslity's original script and runs measurement cycles every 30 minutes except from 8:59pm to 3:59am, when it does not measure except once at 10 pm and once at 2 am. This script lights up the blue LED during the 10 second baseline measurement period, then turns it off when the 5 second heating period begins and keeps it off for the following 100 second measurement period.
Testing the sensor
After receiving a bad batch of MOSFET-Ns, I prefer to test the sensor on battery with a thermocouple thermometer attached to the heater probe to ensure it is heating up. Failure to heat up may indicate a MOSFET-N failure, but the resistance of the heater wire should be tested first.
I also advise you to let the sensor run a few times with its probes installed in the lab. Check the data and make sure the time is correct, and that the temperature values are about what you'd expect. If you use different thermistors than what I used, you'll need to change the temperature-resistance curve equations in the main script.
This is what the data should look like:
| Year | Month | Day | Hour | Minute | Second | Thermistor_1 | Thermistor_2 | Thermistor_3 | Thermistor_4 | Thermistor_5 | Thermistor_6 | Thermistor_7 | Thermistor_8 | Voltage | Flag | EMU |
|---|---|---|---|---|---|---|---|---|---|---|---|---|---|---|---|---|
| 25 | 4 | 16 | 11 | 3 | 18.00 | 23.250 | 23.334 | 23.429 | 23.508 | 23.691 | 23.602 | 23.785 | 23.592 | 6.50 | b | |
| 25 | 4 | 16 | 11 | 3 | 18.50 | 23.290 | 23.374 | 23.463 | 23.542 | 23.731 | 23.641 | 23.825 | 23.627 | 6.73 | b | |
| 25 | 4 | 16 | 11 | 3 | 19.00 | 23.285 | 23.374 | 23.468 | 23.542 | 23.735 | 23.646 | 23.825 | 23.627 | 6.73 | b | |
| 25 | 4 | 16 | 11 | 3 | 19.50 | 23.290 | 23.379 | 23.463 | 23.547 | 23.735 | 23.646 | 23.825 | 23.632 | 6.76 | b | |
| 25 | 4 | 16 | 11 | 3 | 20.00 | 23.295 | 23.379 | 23.468 | 23.547 | 23.740 | 23.646 | 23.830 | 23.632 | 6.73 | b | |
| 25 | 4 | 16 | 11 | 3 | 20.50 | 23.295 | 23.379 | 23.468 | 23.547 | 23.740 | 23.651 | 23.830 | 23.637 | 6.73 | b | |
| 25 | 4 | 16 | 11 | 3 | 21.00 | 23.295 | 23.384 | 23.473 | 23.547 | 23.745 | 23.651 | 23.825 | 23.637 | 6.76 | b | |
| 25 | 4 | 16 | 11 | 3 | 21.50 | 23.305 | 23.384 | 23.473 | 23.552 | 23.745 | 23.651 | 23.834 | 23.637 | 6.73 | b | |
| 25 | 4 | 16 | 11 | 3 | 22.00 | 23.300 | 23.389 | 23.478 | 23.552 | 23.745 | 23.656 | 23.834 | 23.641 | 6.73 | b | |
| 25 | 4 | 16 | 11 | 3 | 22.50 | 23.305 | 23.389 | 23.473 | 23.552 | 23.750 | 23.656 | 23.834 | 23.637 | 6.73 | b | |
| 25 | 4 | 16 | 11 | 3 | 23.00 | 23.325 | 23.399 | 23.488 | 23.567 | 23.760 | 23.671 | 23.849 | 23.651 | 6.73 | h | |
| 25 | 4 | 16 | 11 | 3 | 23.50 | 23.305 | 23.399 | 23.483 | 23.557 | 23.760 | 23.666 | 23.839 | 23.646 | 6.73 | h | |
| 25 | 4 | 16 | 11 | 3 | 24.00 | 23.310 | 23.394 | 23.478 | 23.557 | 23.755 | 23.661 | 23.844 | 23.641 | 6.73 | h | |
| 25 | 4 | 16 | 11 | 3 | 24.50 | 23.310 | 23.394 | 23.478 | 23.557 | 23.755 | 23.666 | 23.839 | 23.641 | 6.73 | h | |
| 25 | 4 | 16 | 11 | 3 | 25.00 | 23.310 | 23.394 | 23.478 | 23.552 | 23.755 | 23.661 | 23.834 | 23.637 | 6.73 | h | |
| 25 | 4 | 16 | 11 | 3 | 25.50 | 23.305 | 23.394 | 23.478 | 23.557 | 23.755 | 23.661 | 23.834 | 23.637 | 6.73 | h | |
| 25 | 4 | 16 | 11 | 3 | 26.00 | 23.305 | 23.394 | 23.483 | 23.557 | 23.750 | 23.661 | 23.834 | 23.637 | 6.73 | h | |
| 25 | 4 | 16 | 11 | 3 | 26.50 | 23.310 | 23.399 | 23.483 | 23.552 | 23.755 | 23.661 | 23.839 | 23.637 | 6.73 | h | |
| 25 | 4 | 16 | 11 | 3 | 27.00 | 23.310 | 23.399 | 23.483 | 23.552 | 23.755 | 23.666 | 23.834 | 23.641 | 6.73 | h | |
| 25 | 4 | 16 | 11 | 3 | 27.50 | 23.310 | 23.394 | 23.483 | 23.557 | 23.760 | 23.666 | 23.839 | 23.637 | 6.73 | h | |
| 25 | 4 | 16 | 11 | 3 | 28.00 | 23.295 | 23.384 | 23.468 | 23.542 | 23.745 | 23.656 | 23.830 | 23.627 | 6.73 | c | |
| 25 | 4 | 16 | 11 | 3 | 28.50 | 23.305 | 23.389 | 23.473 | 23.547 | 23.750 | 23.656 | 23.834 | 23.632 | 6.73 | c | |
| 25 | 4 | 16 | 11 | 3 | 29.00 | 23.300 | 23.394 | 23.478 | 23.557 | 23.755 | 23.666 | 23.839 | 23.637 | 6.73 | c | |
| 25 | 4 | 16 | 11 | 3 | 29.50 | 23.305 | 23.399 | 23.478 | 23.557 | 23.760 | 23.666 | 23.839 | 23.641 | 6.73 | c | |
| 25 | 4 | 16 | 11 | 3 | 30.00 | 23.305 | 23.394 | 23.483 | 23.557 | 23.760 | 23.671 | 23.844 | 23.641 | 6.73 | c | |
| 25 | 4 | 16 | 11 | 3 | 30.50 | 23.310 | 23.394 | 23.483 | 23.557 | 23.760 | 23.671 | 23.844 | 23.646 | 6.73 | c | |
| 25 | 4 | 16 | 11 | 3 | 31.00 | 23.305 | 23.399 | 23.483 | 23.557 | 23.760 | 23.671 | 23.844 | 23.646 | 6.73 | c | |
| 25 | 4 | 16 | 11 | 3 | 31.50 | 23.310 | 23.399 | 23.488 | 23.557 | 23.765 | 23.676 | 23.849 | 23.646 | 6.73 | c | |
| 25 | 4 | 16 | 11 | 3 | 32.00 | 23.310 | 23.399 | 23.488 | 23.562 | 23.765 | 23.676 | 23.849 | 23.651 | 6.73 | c |
The "Flag" column notes whether that timepoint represents a "b"aseline measurement, a "h"eating measurement, or a "c"ooling measurement.
If you see unexpected or missing temperature data, try testing the offending probes' resistances with a multimeter. Sometimes if the soldering job was bad, the probes will work in some orientations but fail if bent a different direction. This can be fixed with some "probe surgery".
Installing the sensor
Required tools:
- Drill guide block (I had this custom-machined)
- Chisel and hammer to remove bark
- Pliers
- Ratchet strap, bungee cord, or screws to secure drill guide block
- Thermal grease (e.g. Super Lube 98003)
- Cordless drill with sufficiently long 1.7 mm diameter drill bit (for 16-gauge needles)
- Zip-ties or screws to secure sensor to tree
Your sensor should be powered up, programmed, sealed, and ready to go. In fact, if prepared correctly, there should be no need to open them in the field prior to install--helpful for rainy places!
At minimum, you need drill bits that are as long as your probes once they're locked into your drill chuck. If you're using 4-inch or longer probes, finding long enough drill bits can be a challenge. I found a bunch of 100 mm long 1.7 mm diameter drill bits on AliExpress and used those with success. The 100 mm length is also good for two-inch probes, as they reach about two inches into the tree when using an inch-thick drill guide and a drill with a chuck that's about an inch deep.
Step 1: Prepare the installation site
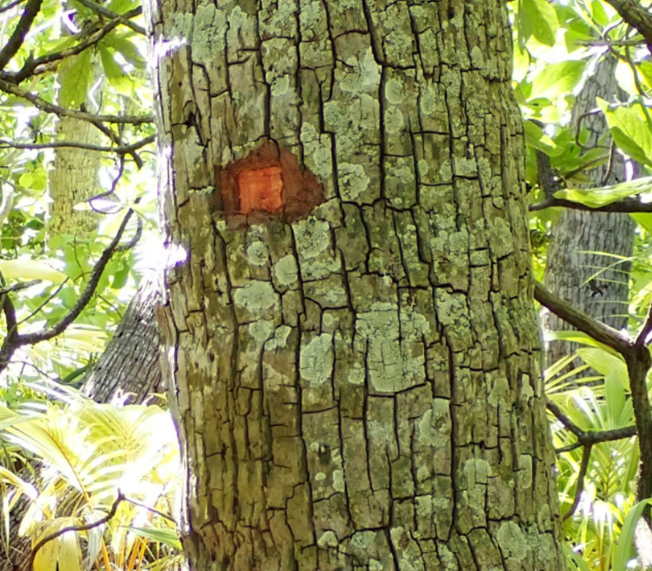
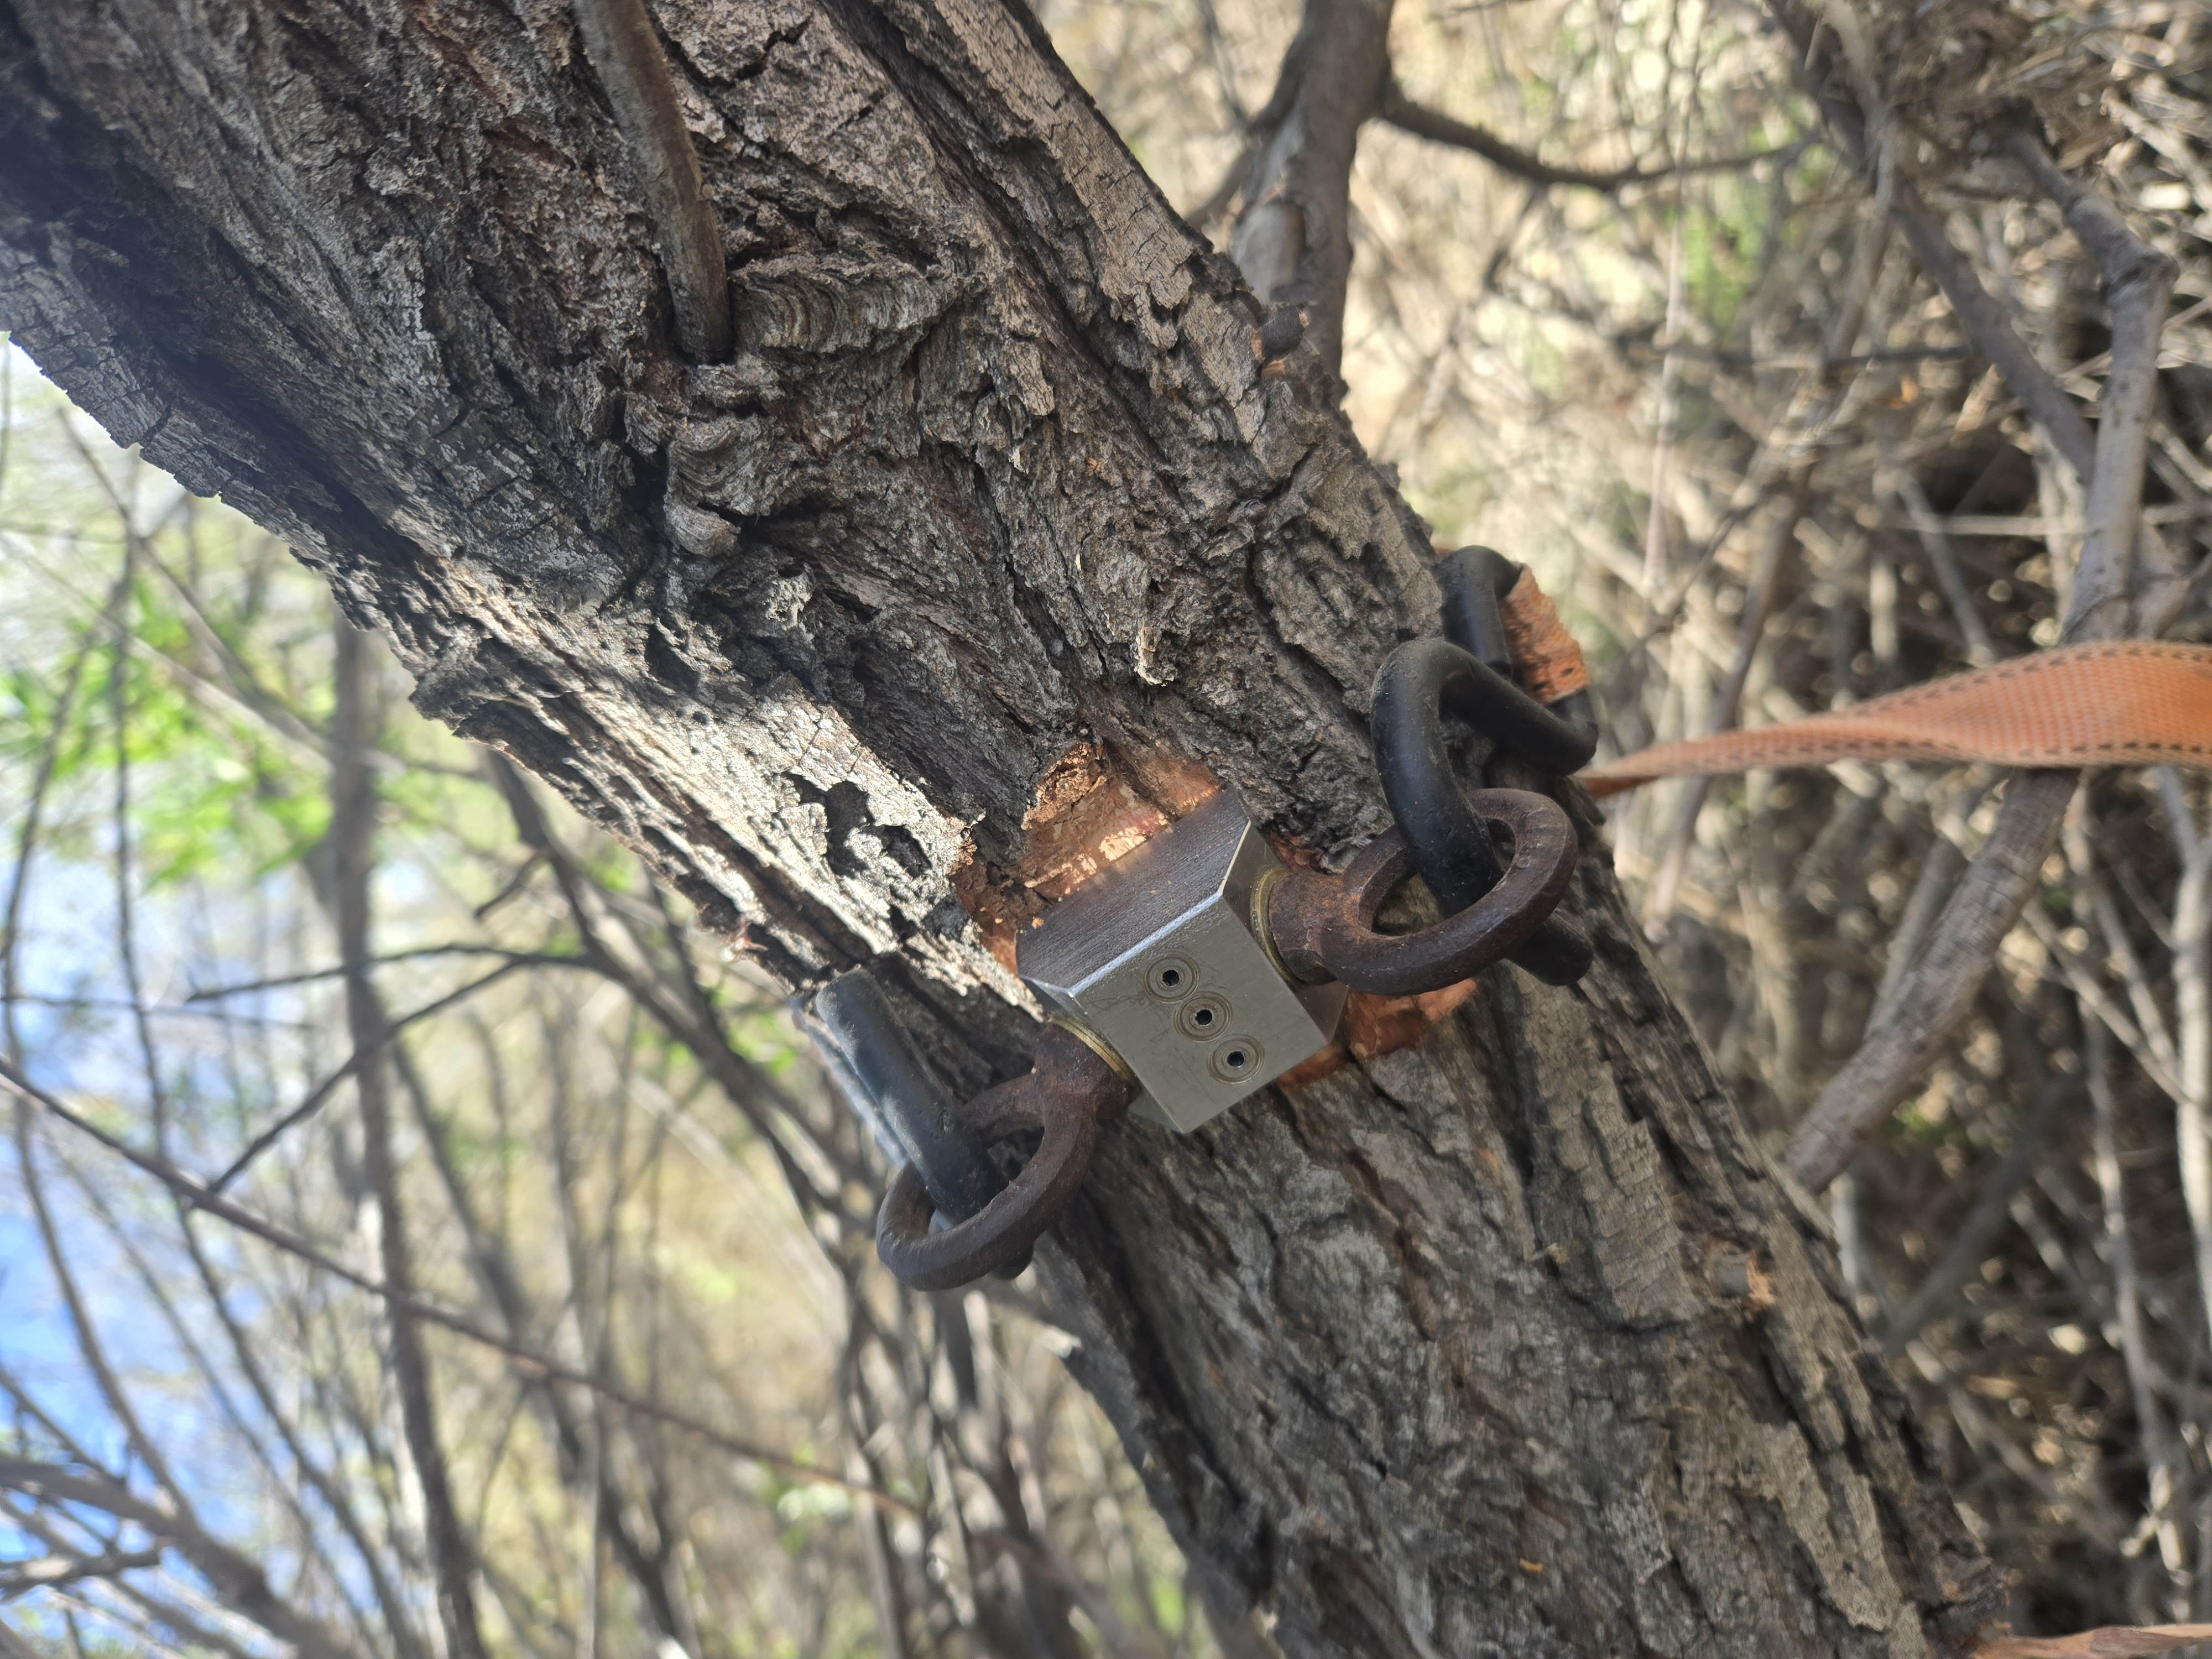
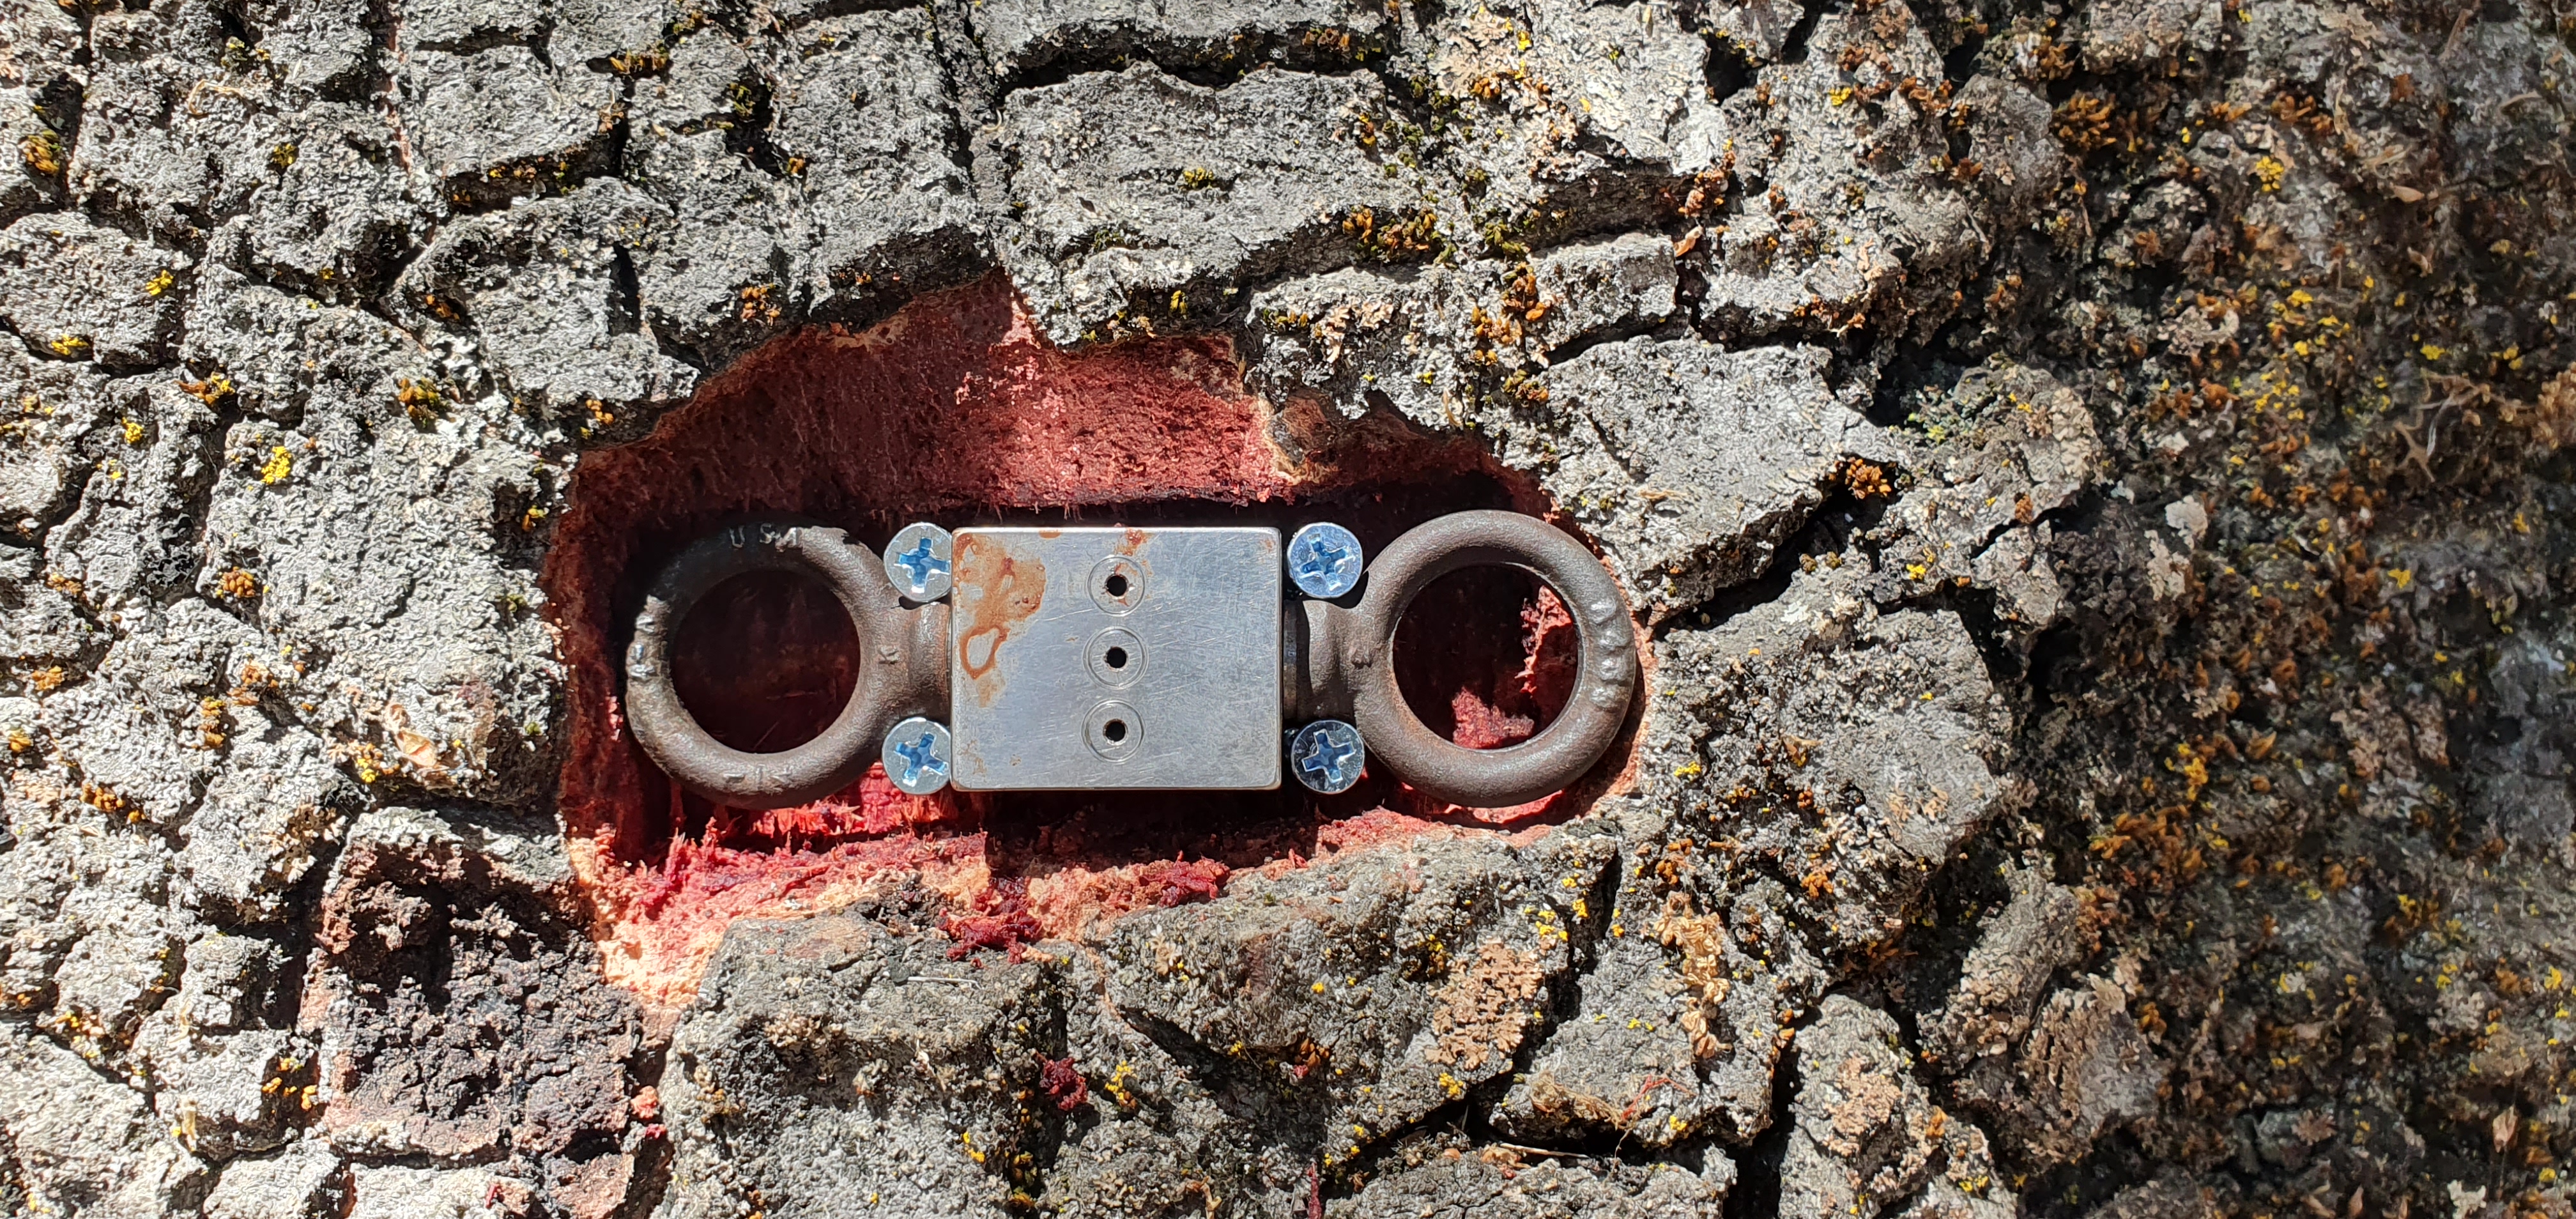
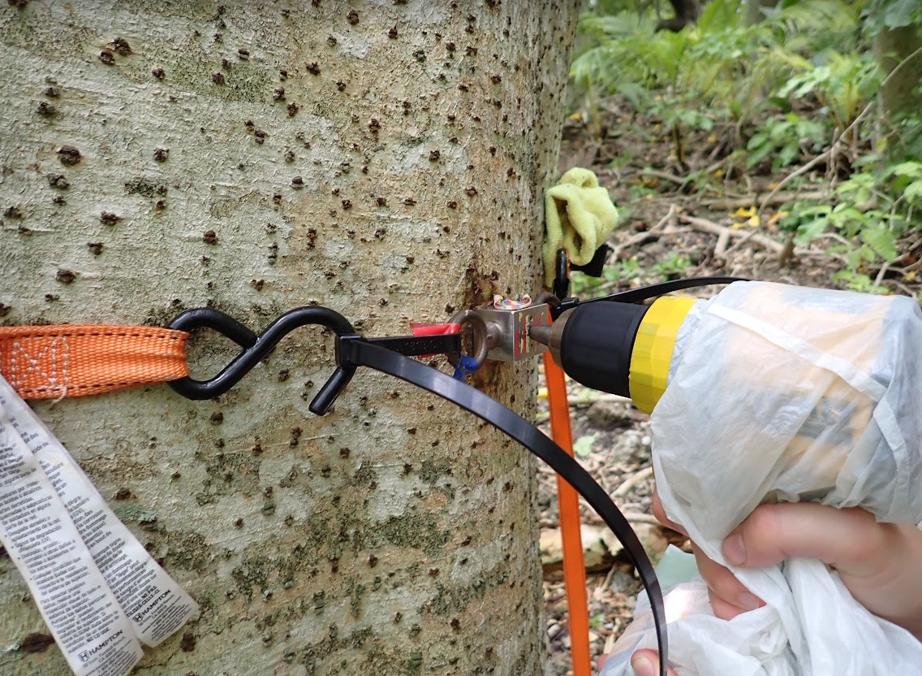
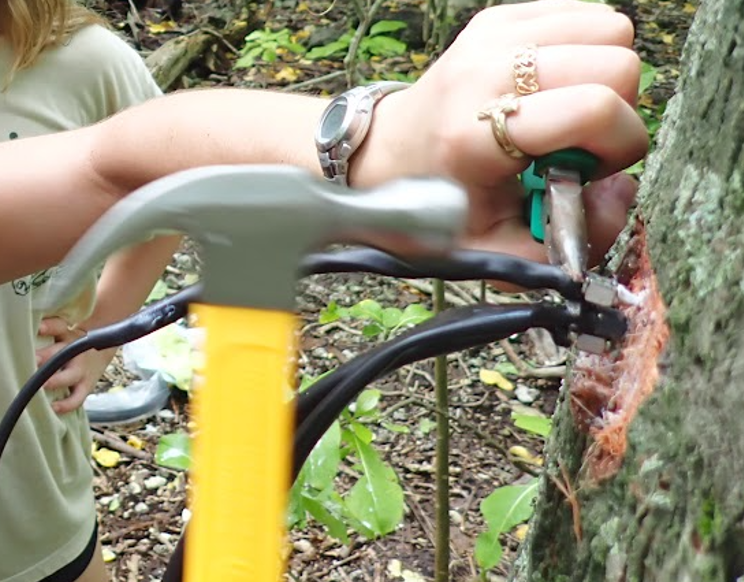
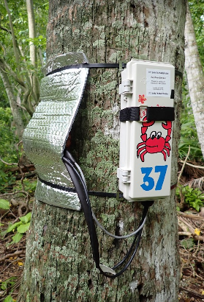
Once you've picked your spot, use a hammer and chisel to cut out a square section of bark, taking care not to cut into active sapwood.
Once you're through the bark, put your drill guide into place. We had several iterations of steel drill guides custom fabricated by the UC Santa Barbara Department of Physics machine shop. They were 1 inch thick, had 1.71mm holes spaced 7 mm apart, and two eye-bolts for use with a ratchet strap. Here's an AutoCAD file with one such design.
The ratchet straps work well in most cases, particularly the version in that AutoCAD file which has elevated eye-bolts. But some trees with big concavities make it hard to use them (as the drill guide will not be pressed against the bark if you're working within a concavity). One iteration of our drill guide had horizontal eye-bolts that could be used with four screws to secure the drill guide in cases like this.
Step 2: Drill
Once your drill guide is in place, it's time to drill! It's of paramount importance to not bend the drill bit, both for the accuracy of the probe alignment and to not break the bit and waste all that drilling time. I recommend having one person watch from the side and tell the driller if they are tilting up or down, and have the driller watch from above to ensure they're straight in the left-right direction.
The drilling itself is a patient task. Since the drill bit is so thin, to avoid breakage you must only drill about a centimeter at a time before pulling the bit out and cleaning wood out of the flutes. Each time, I try to start spinning the drill before inserting it into the hole, and keep it spinning fast enough for a clean hole but not so fast that it's burning hot to the touch when you take it out. Eventually you'll get it deep enough for your probe, and then I like to give each hole a few extra sweeps to get any debris out.
Ideally, you have drill bits that are long enough to penetrate both the drill guide and the full length of your steel probes. If not, you'll need to partially drill all three holes, then remove the drill guide and continue drilling each hole to the proper depth.
Step 3: Insert the probes
Once your holes are drilled and cleaned, it's time to insert the probes. Cover each probe with a generous amount of thermal grease and carefully shove them into the holes, noting which probe is the upstream (bottom) probe and which is the heater probe that goes in the middle. Some tree species leave nice drill holes that can easily be inserted into, but it's important not to try forcing the probes in with your hands--you can easily bend the probes this way.
I recommend getting a probe as deep as you can with your fingers, then using a hammer and pair of pliers to tap it in the rest of the way. The trick is to get the pliers on the base of the needle where you can get solid purchase on metal, then tapping the pliers with the hammer to transfer the force to the needle.
Step 4: Finishing touches
Once the probes are inserted, decide where and how you'll put the sensor on the tree. I like to place the sensor such that the cables hang down between the box and the probes, providing a place for water to drip off the sensor without accumulating at the probes or at the box. Cut a strip of Reflectix (radiant insulation) and put it over the probes to keep the sun off of them, and you're done!
Step 5: Ongoing maintenance
I recommend letting the sensor run for 1-3 days and then checking the data. It's handy to use a TXT file reader on your phone or computer that allows you to jump to the bottom of the file (e.g. Notepad++ on PC, in which Ctrl+End jumps to the bottom) otherwise it can take a while to scroll once the files get large. Check that the logger is recording data as expected with correct timestamps and that probes are all reading realistic temperatures (a few degrees of disagreement is okay, as you'll use baseline temperatures to normalize the thermistors, but if a thermistor's baseline readings are too far off then a linear normalization will no longer be sufficient because the thermistor will be operating on a different region of the nonlinear resistance-temperature curve).
If there are any problematic thermistors, use a multimeter to isolate the problem. If it's the probes, you can try surgically repairing the connections in the probes or replacing the problem probe completely. If it's the data logger, you can replace that too. Sometimes just unscrewing the wire terminals and re-screwing them, or cleaning the wire ends if they've been deployed for a while, can help.
If the data logger has not been running, check the microSD card to see when it stopped. If it says something like "low voltage error" at the last line, look at the Voltage column in the data and see if the battery voltage showed signs of declining past the low voltage threshold in the code (the battery state can be confirmed with a multimeter). This error can also occur if you run it off USB power, but that would probably have been noticed in the lab. If the logger seems to have stopped running spontaneously with plenty of battery life, wiggle the battery connection and MOSFETs to see if the LED turns on. If that doesn't work, it's possible the battery died in the RTC, preventing the logger from waking up. You can try replacing the CR2032 watch battery in the RTC and reprogramming the sensor. Note that for any fix involving reprogramming the sensor, you'll probably need to wait for the next hour or half-hour to observe whether a measurement cycle proceeds successfully.
If nothing above worked, then I would just replace the data logger.
Charging the batteries
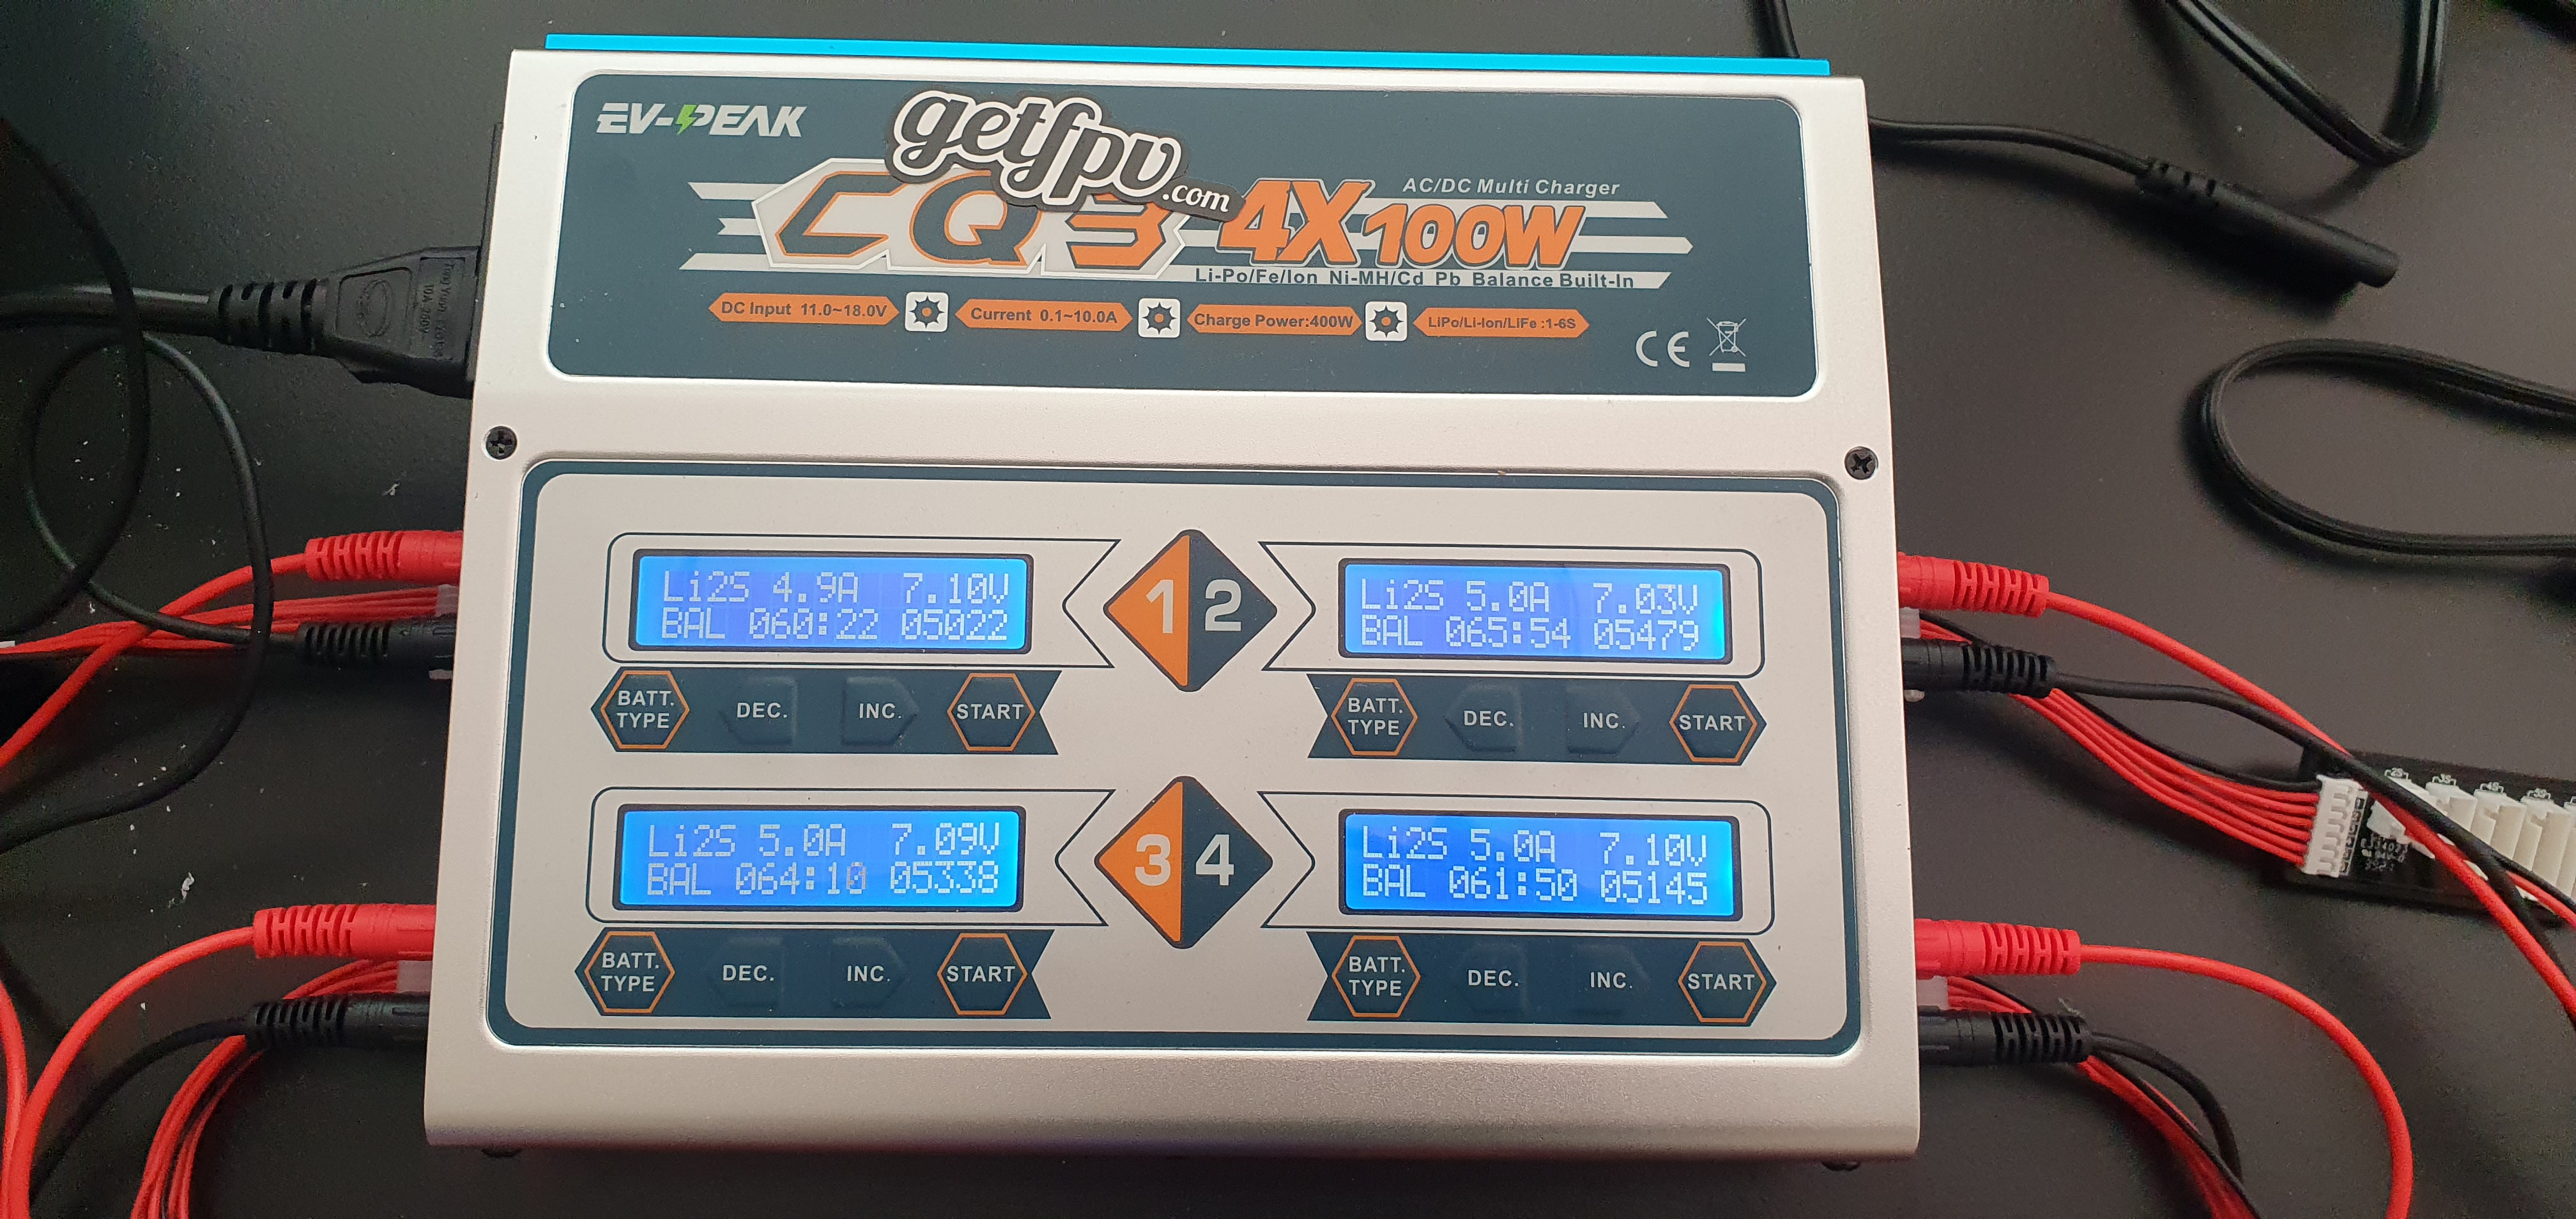
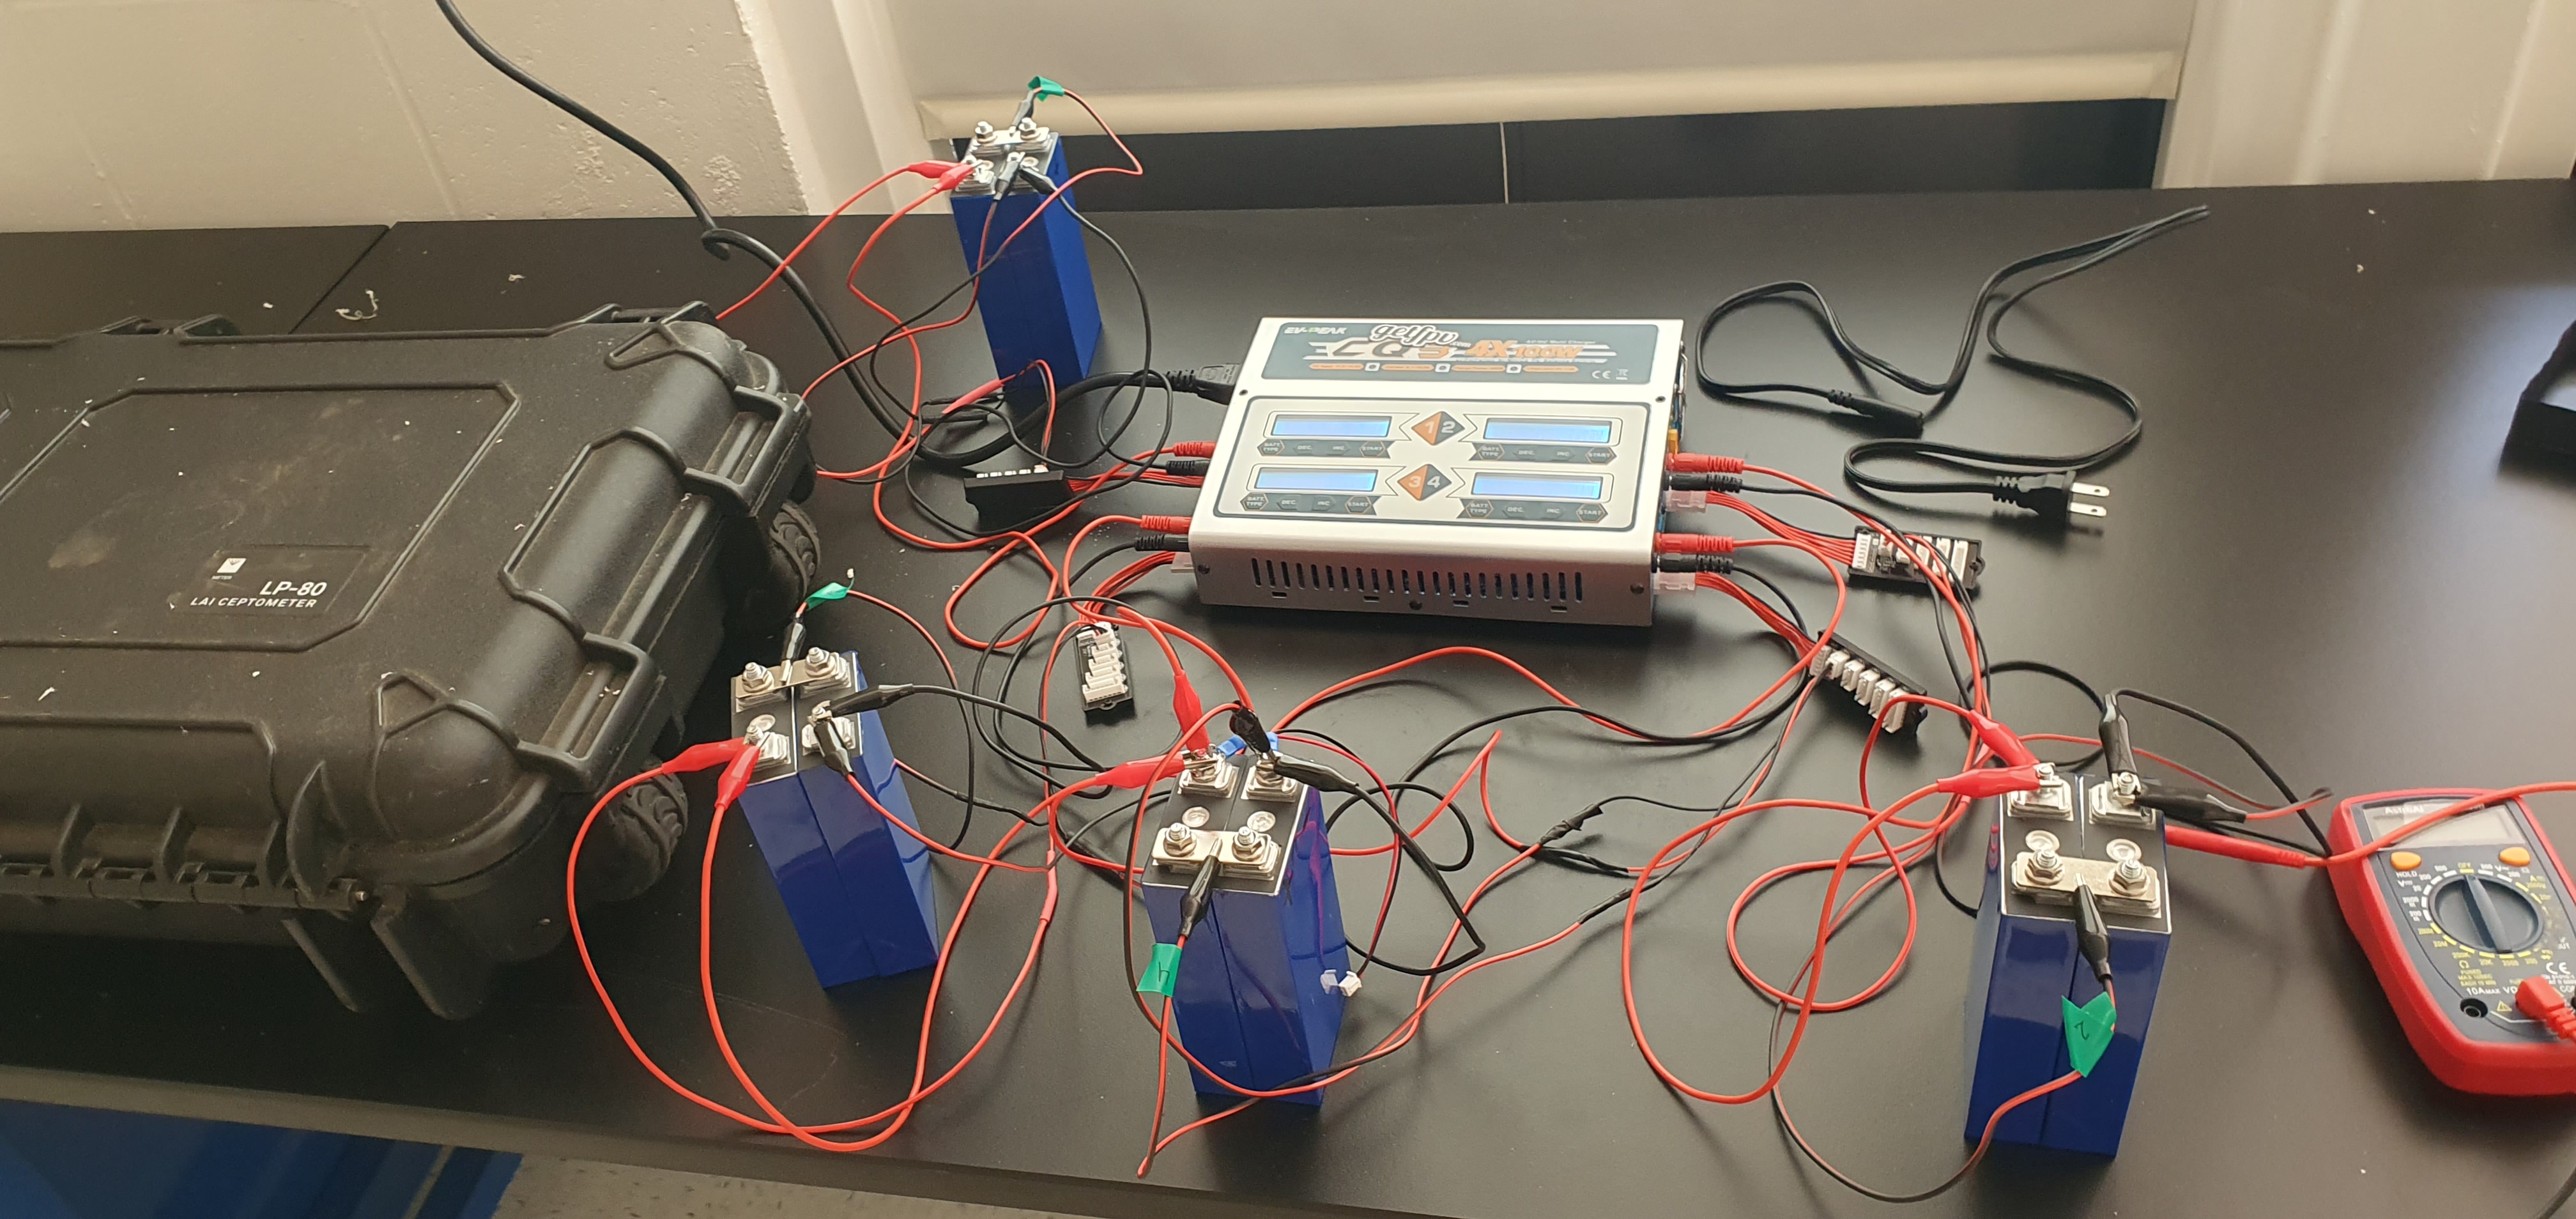
To charge the big prismatic LiFePO4 batteries I used in the sap flow sensors, I recommend you use a balance charger. This will let you charge both cells in each battery pack simultaneously and get them to the same state of charge, extending the life of the battery.
I recommend the EV-Peak CQ3 charger, which allows you to charge four battery packs at once. There are also single-pack chargers like the EV-Peak C1-XR available for less money. These chargers come with balance boards and compatible wires that allow you to create a charging circuit with a "middle leg" that attaches to the bar connecting your two cells together, but you'll want to buy some wires with alligator clips and do some splicing so that you can attach this circuit to your cells.
Please do some reading to make sure you understand how balance charging works and ensure you have the wiring correct! I charged my batteries in 2S LiFe mode at 5 amps with capacity set to 25 Ah. If you're in a hurry to charge a lot of batteries, for instance during a field campaign on a remote tropical atoll with short weather windows (ask me how I know), you can bump it up to 10 amps (the maximum current on the EV-Peak chargers).
Voltage Loggers for FloraPulse and other Analog Probes
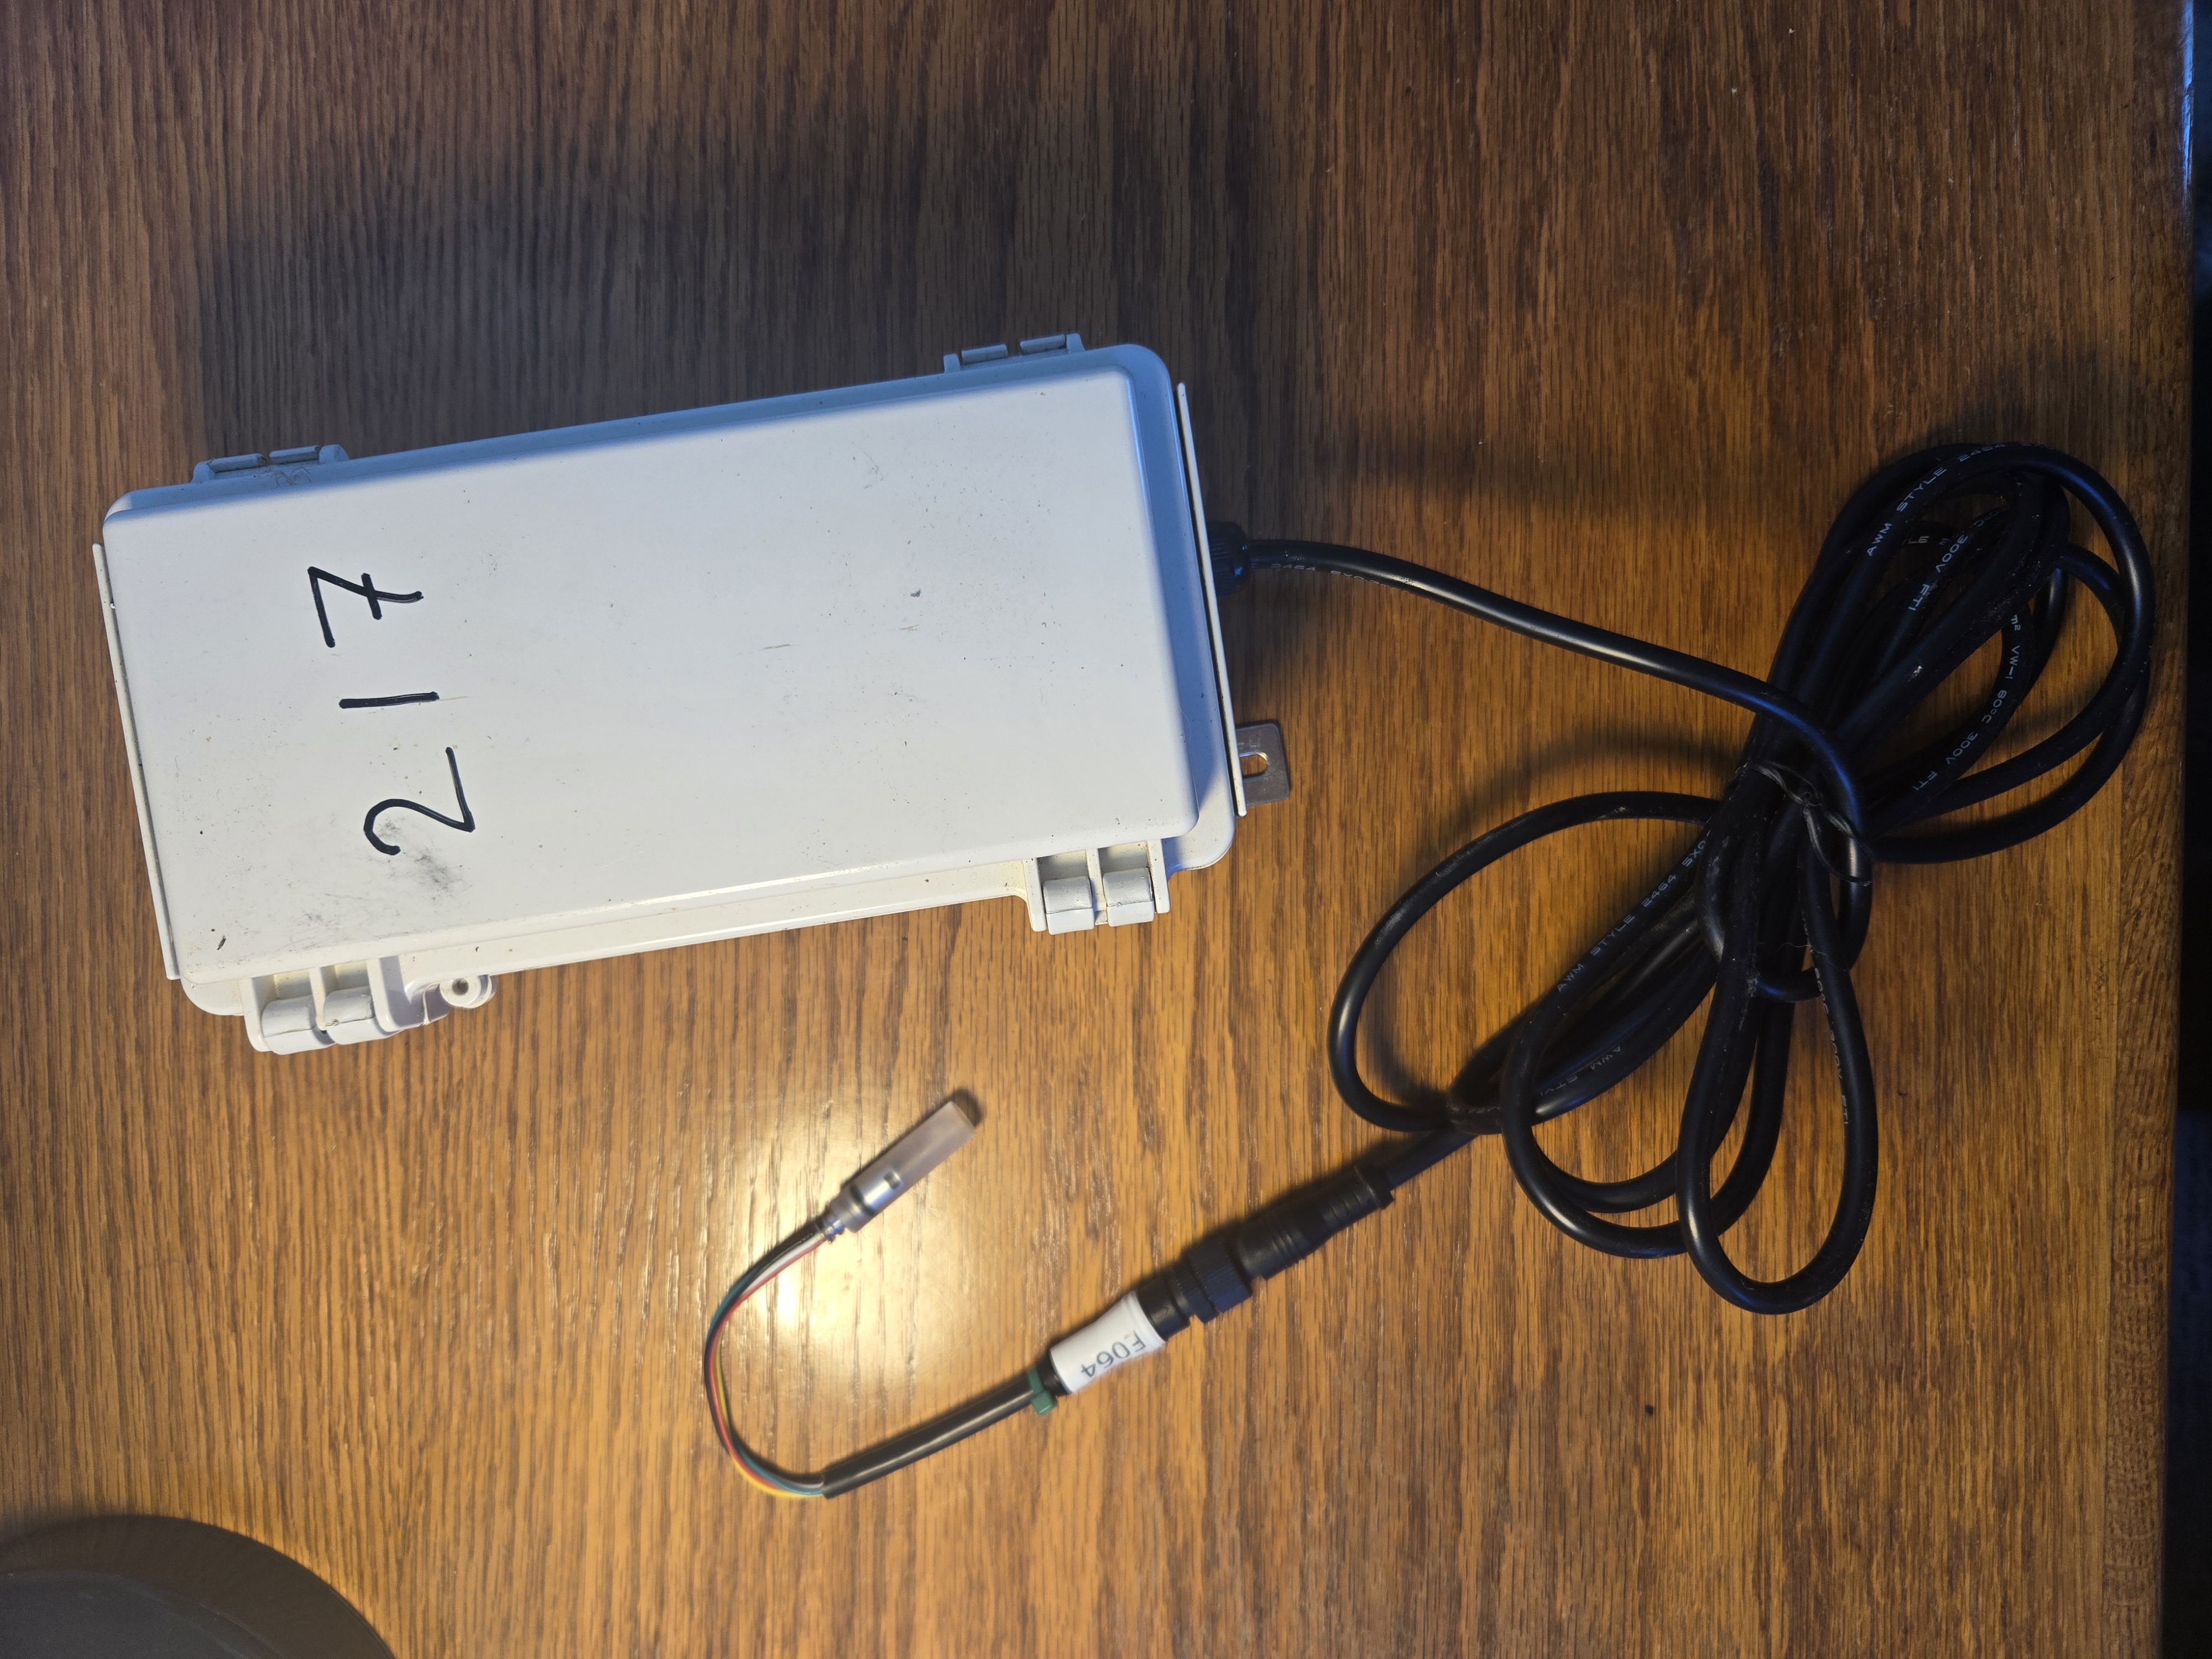
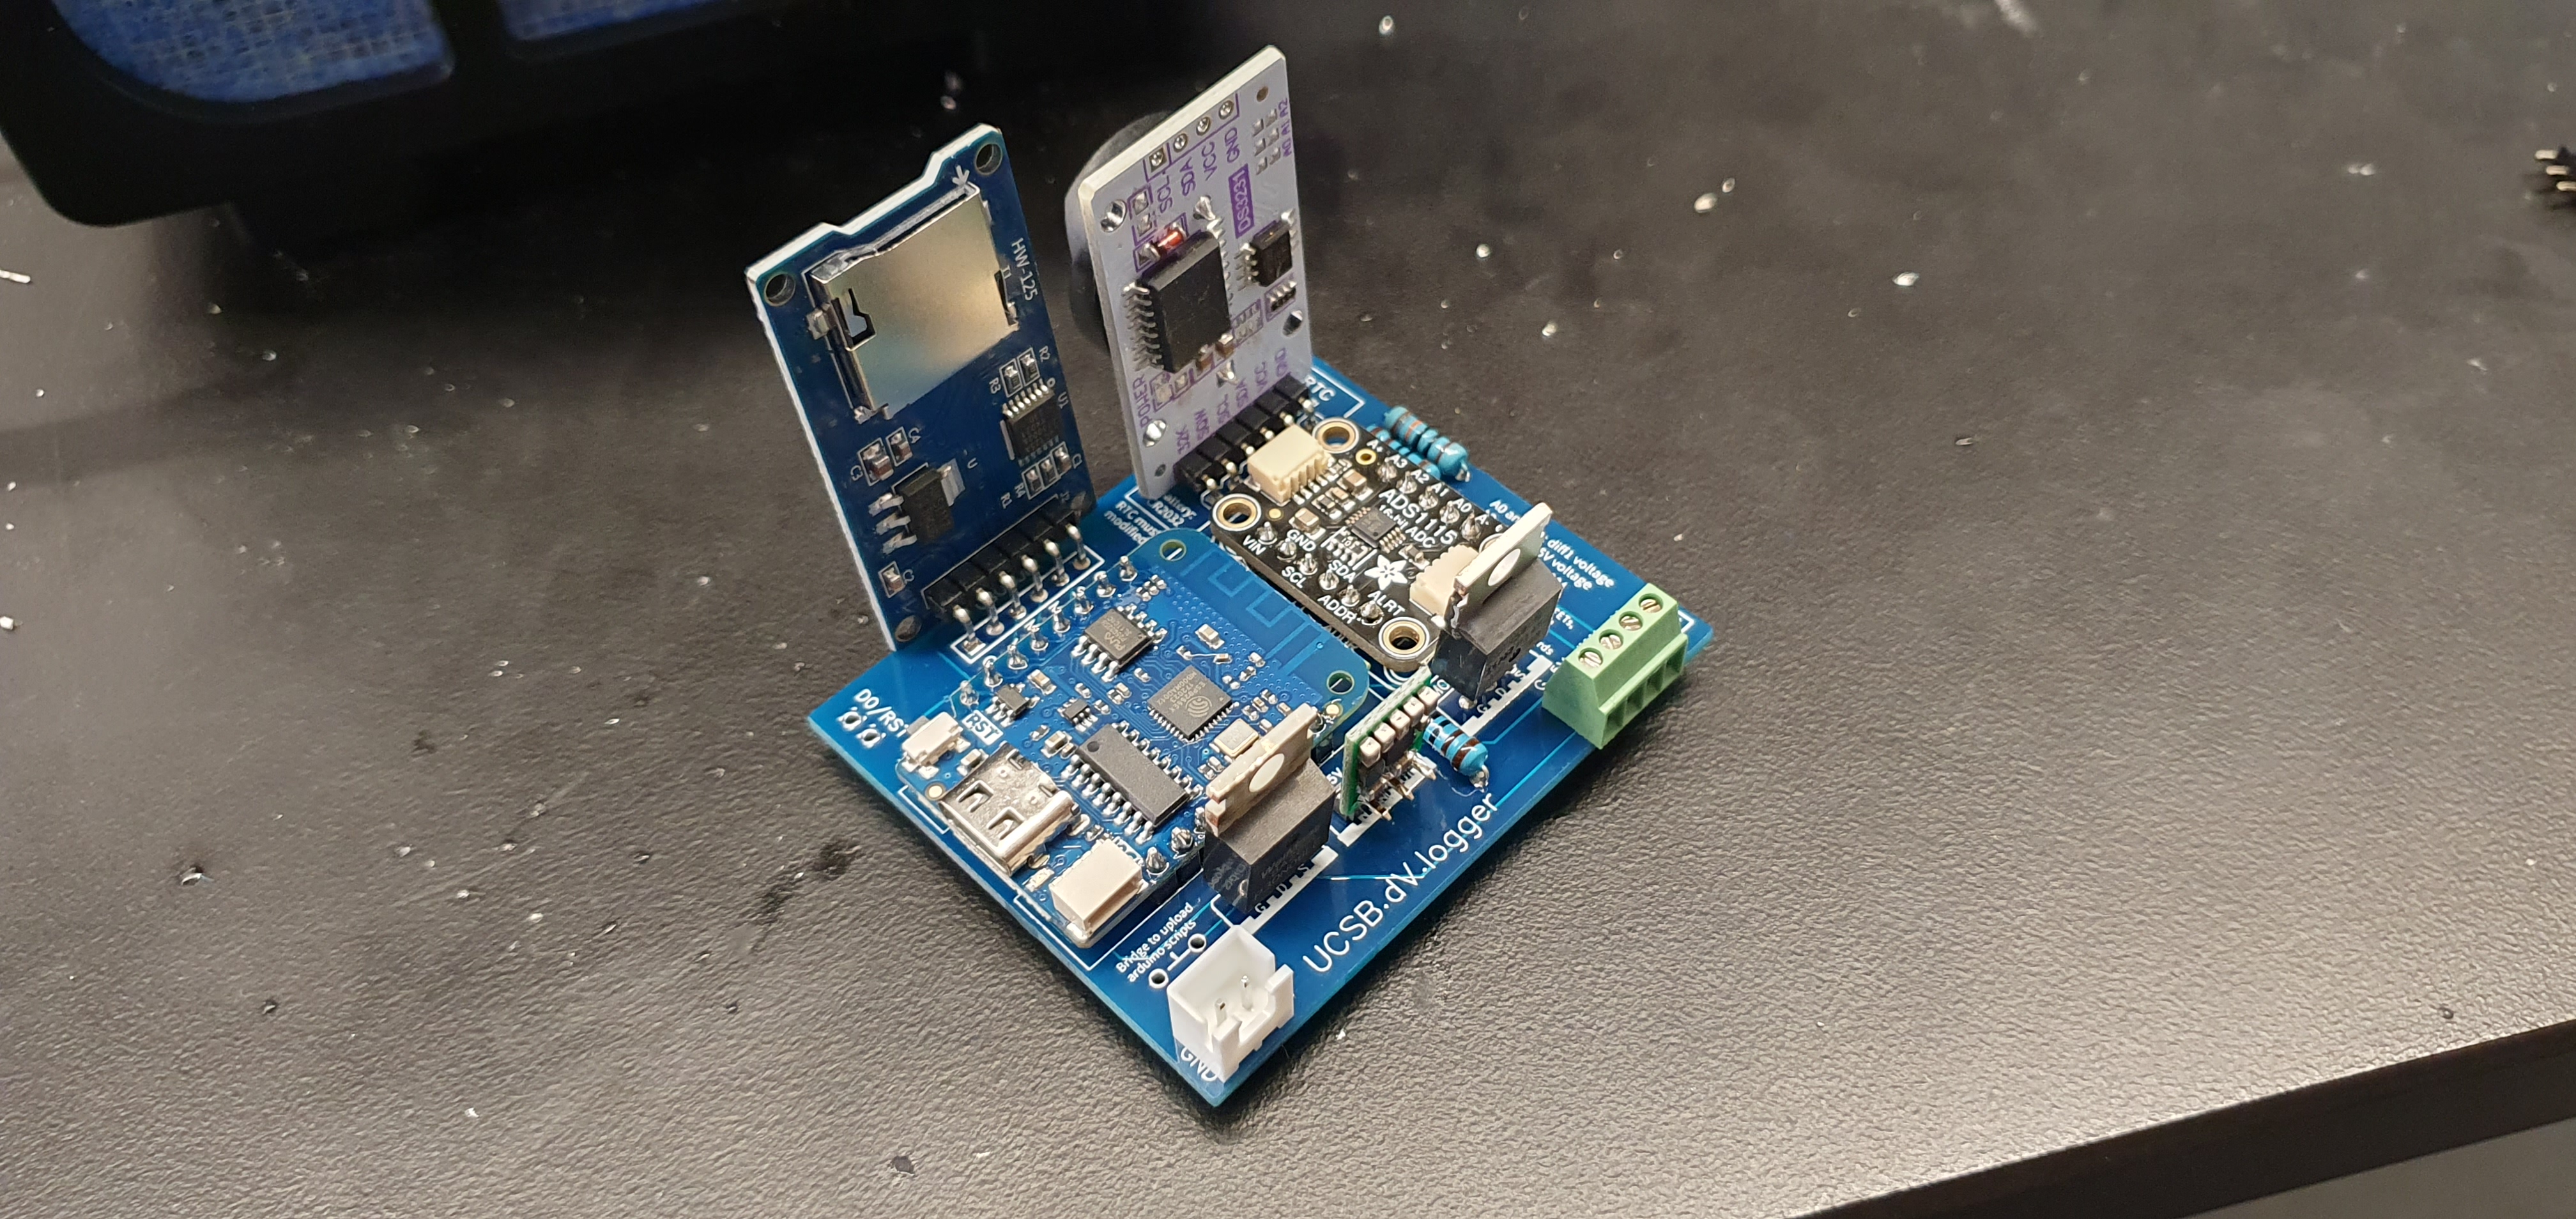
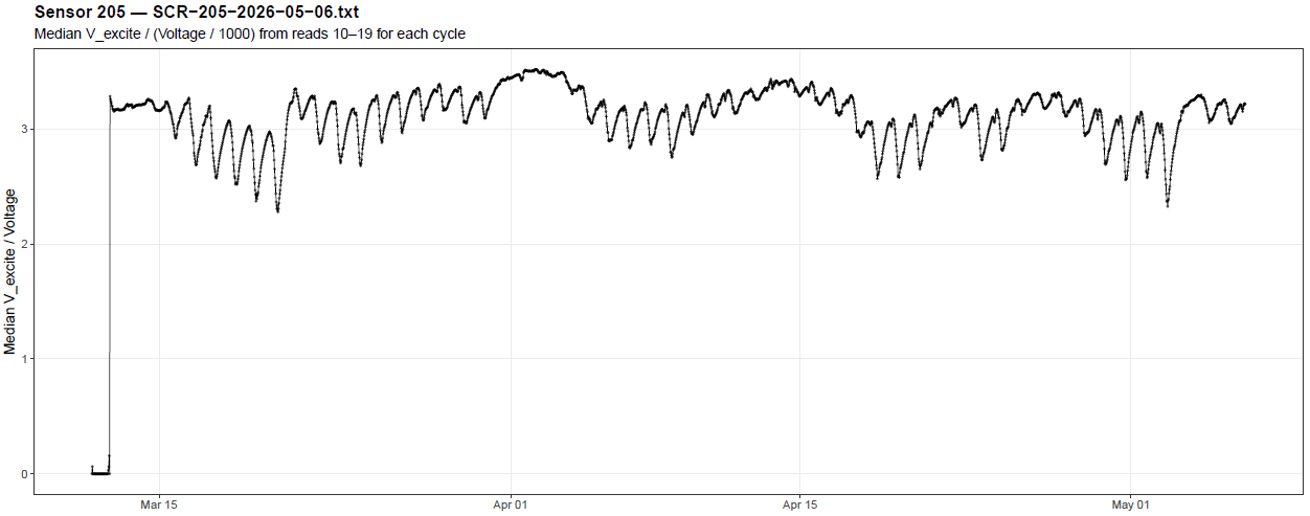
Building off the sapflow sensor design, I created DIY analog voltage loggers that can be used with any sensor that takes an excitation voltage as input and outputs an analog signal as a return voltage differential. I have found these data loggers to be inexpensive, adaptable, precise, and reliable, making them a good option for replacing other more expensive analog data loggers on the market.
My primary goal was to use them with analog microtensiometers from FloraPulse, which receive a 10-millisecond excitation voltage from 1 to 10 V, during which an output voltage differential must be measured. The output voltage differential is from -32 to +32 mV per V of excitation voltage.
Since I already had a bunch of Pololu S7V7F5 5-volt regulators, I decided I would excite the FloraPulse probes at 5V. This has the added benefit of amplifying the return signal to the range of hundreds of mV. If you want to output a different excitation voltage, you may need to slightly redesign the PCB because in the current design the 5V regulator that outputs the excitation voltage is the same regulator delivering power to the rest of the data logger, which must be around 5-6 volts.
The loggers use much of the same architecture as the sap flow data loggers, including the same RTC-MOSFET sleep/wake functionality, but with the infrastructure for the eight thermistors stripped down to measure a single voltage differential. The heater circuit has been repurposed to the excitation voltage circuit and the cheap knock-off ADS1115s from Amazon have been replaced with a single ADS1115 purchased from Adafruit to ensure precision and reliably. The Adafruit ADS1115 breakout board is wired to measure the actual voltage output by the 5V excitation circuit using A2 and A3 in differential mode and the voltage output from the "diff1" vias using A0 and A1 in differential mode.
Because these sensors only turn on for less than a second per measurement cycle, they use very little power when deployed in the field for half-hourly measurements. I thus swapped the large batteries used in the sap flow sensors for cheap, USB-chargeable 6 Ah LiFePO4 batteries readily available on Amazon.
Parts list:
(excluding FloraPulse analog probes, which are $500 each at time of writing)
Data loggers
| Part | Model | Number | Cost per unit - USD | Vendor |
|---|---|---|---|---|
| PCB | UCSB.dV.logger.v1.1 | 1 | $1.10 | JLCPCB |
| Microcontroller | Lolin Wemos D1 Mini | 1 | $4.50 | Lolin via AliExpress |
| ADC | ADS1115 | 2 | $14.95 | Adafruit |
| RTC | DS3231SN | 1 | $3.00 | Amazon |
| 5 V Regulator | S7V7F5 | 1 | $7.19 | Pololu |
| P-Channel MOSFET | IRF9540NPBF | 1 | $1.49 | Newark |
| N-Channel MOSFET | IRLZ34PBF | 1 | $2.15 | Newark |
| MicroSD Card Adapter | MicroSD Card Adapter (HW-125) | 1 | $1.20 | Amazon |
| MicroSD Card | Lexar 633x 32GB microSDHC card | 1 | $4.99 | B&H Photo and Video |
| Lithium Coin Cell Batteries | Duracell CR2032 3V batteries | 1 | $1.41 | Costco |
| Terminal block connectors (heater probes) | 4-Pin 2.54mm Pitch Screw Terminal Block Connector | 1 | $0.42 | Amazon |
| 1K ohm Resistors | 1K ohm 0.5W resistors | 2 | $0.11 | Amazon |
| 10K ohm Resistors | 10K ohm 0.5W resistors | 1 | $0.11 | Amazon |
| 100K ohm Resistors | 100K ohm 0.5W resistors | 2 | $0.11 | Amazon |
| Total | $57.90 |
Note: for better reliability, you can purchase a higher-quality versions of the DS3231 RTC from Jameco Electronics under the Velleman brand, but it is much more expensive.
Case and batteries
| Part | Model | Number | Cost per unit - USD | Vendor |
|---|---|---|---|---|
| LiFePO4 batteries | 6 Ah LiFePO4 Battery with USB | 1 | $13.50 | Amazon |
| Battery cables and board connectors | 2.54mm JST-HX 22AWG pre-crimped 20 cm wire set | 1 | $1.50 | Amazon |
| Cable gland | 1/4 inch NPT cable gland | 1 | $0.50 | Amazon |
| Battery connectors | 4.8mm female spade crimp connectors (match size to your chosen batteries) | 2 | $0.07 | Amazon |
| Waterproof case | Polycase WH-06 | 1 | $16.66 | Polycase |
| Velcro tape | VELCRO Extreme outdoor mounting tape | 3 in | $0.11/in | Amazon |
| O-ring grease | Super Lube Silicone O-Ring Grease | (small amount) | $30/tub | Amazon |
| Desiccant packs | Dry & Dry 10 gram indicating desiccant packs | 1 | $0.30 | Amazon |
| Total | $32.93 |
The Gerber file for the PCB design can be downloaded here.
Building the voltage logger
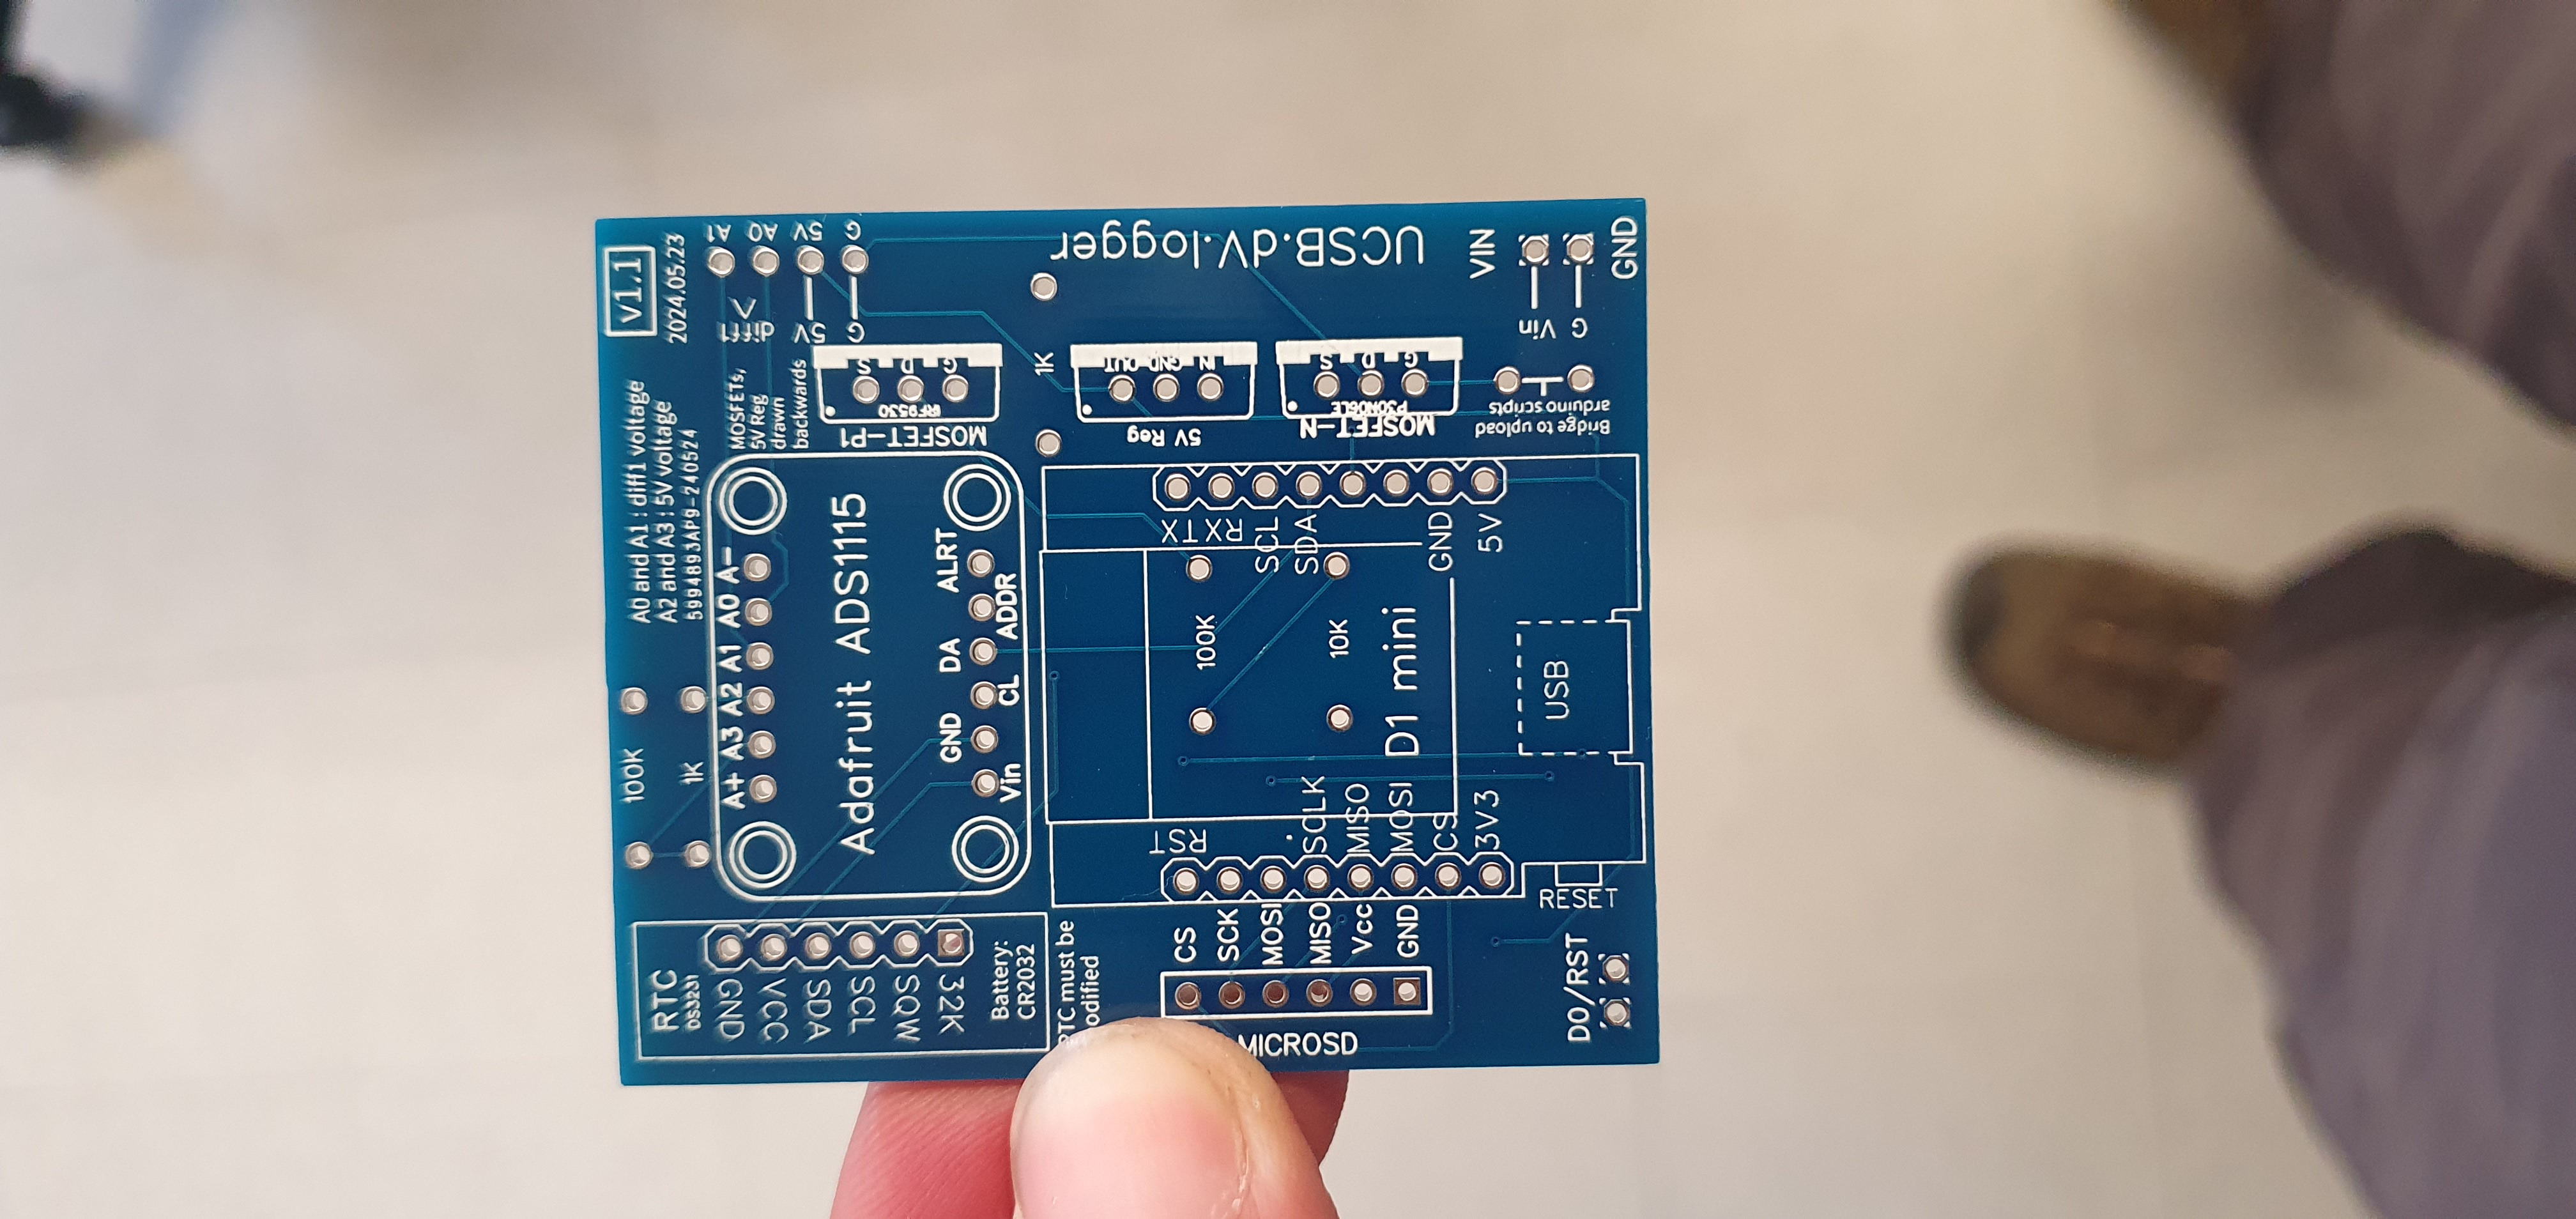
Most of the data logger assembly is similar to the sap flow sensors, so please consult that section above for more information on soldering the components together. As with the sap flow sensors, I recommend you breadboard the breakout boards together, although I found that these data loggers had much lower failure rates even without breadboarding, suggesting many of the compatibility problems when building sap flow data loggers were caused by the two knock-off ADS1115 boards.
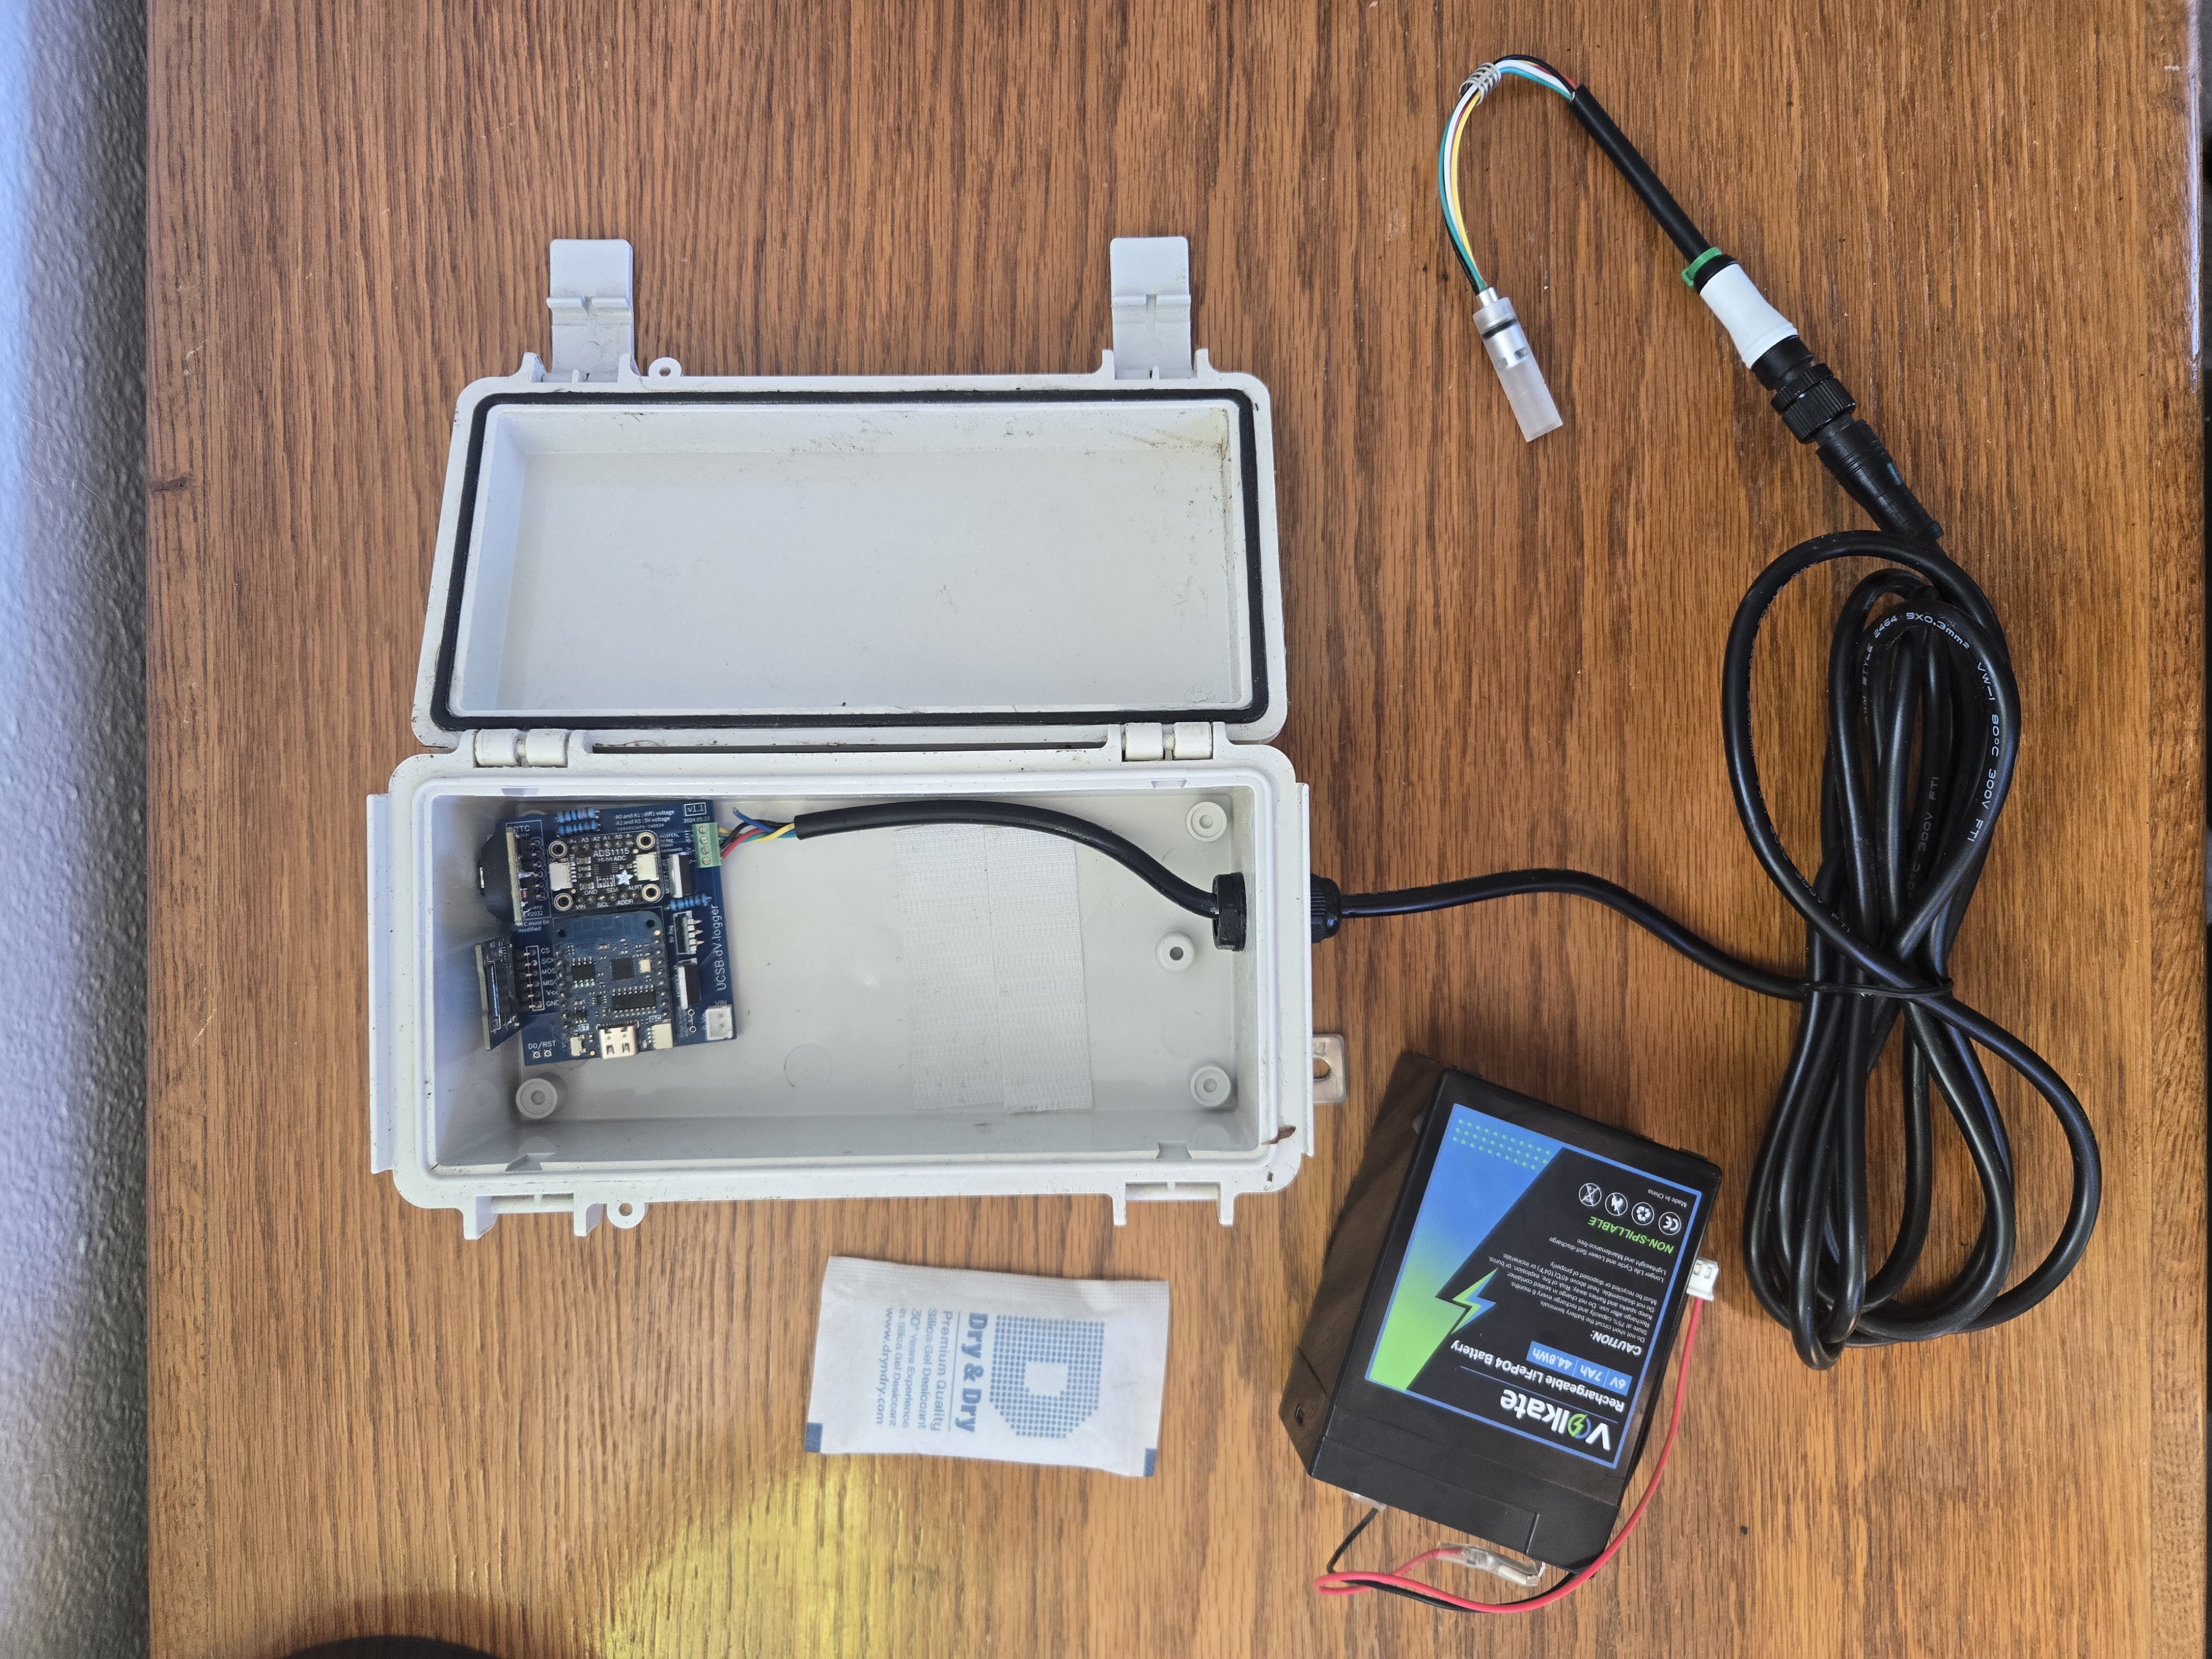
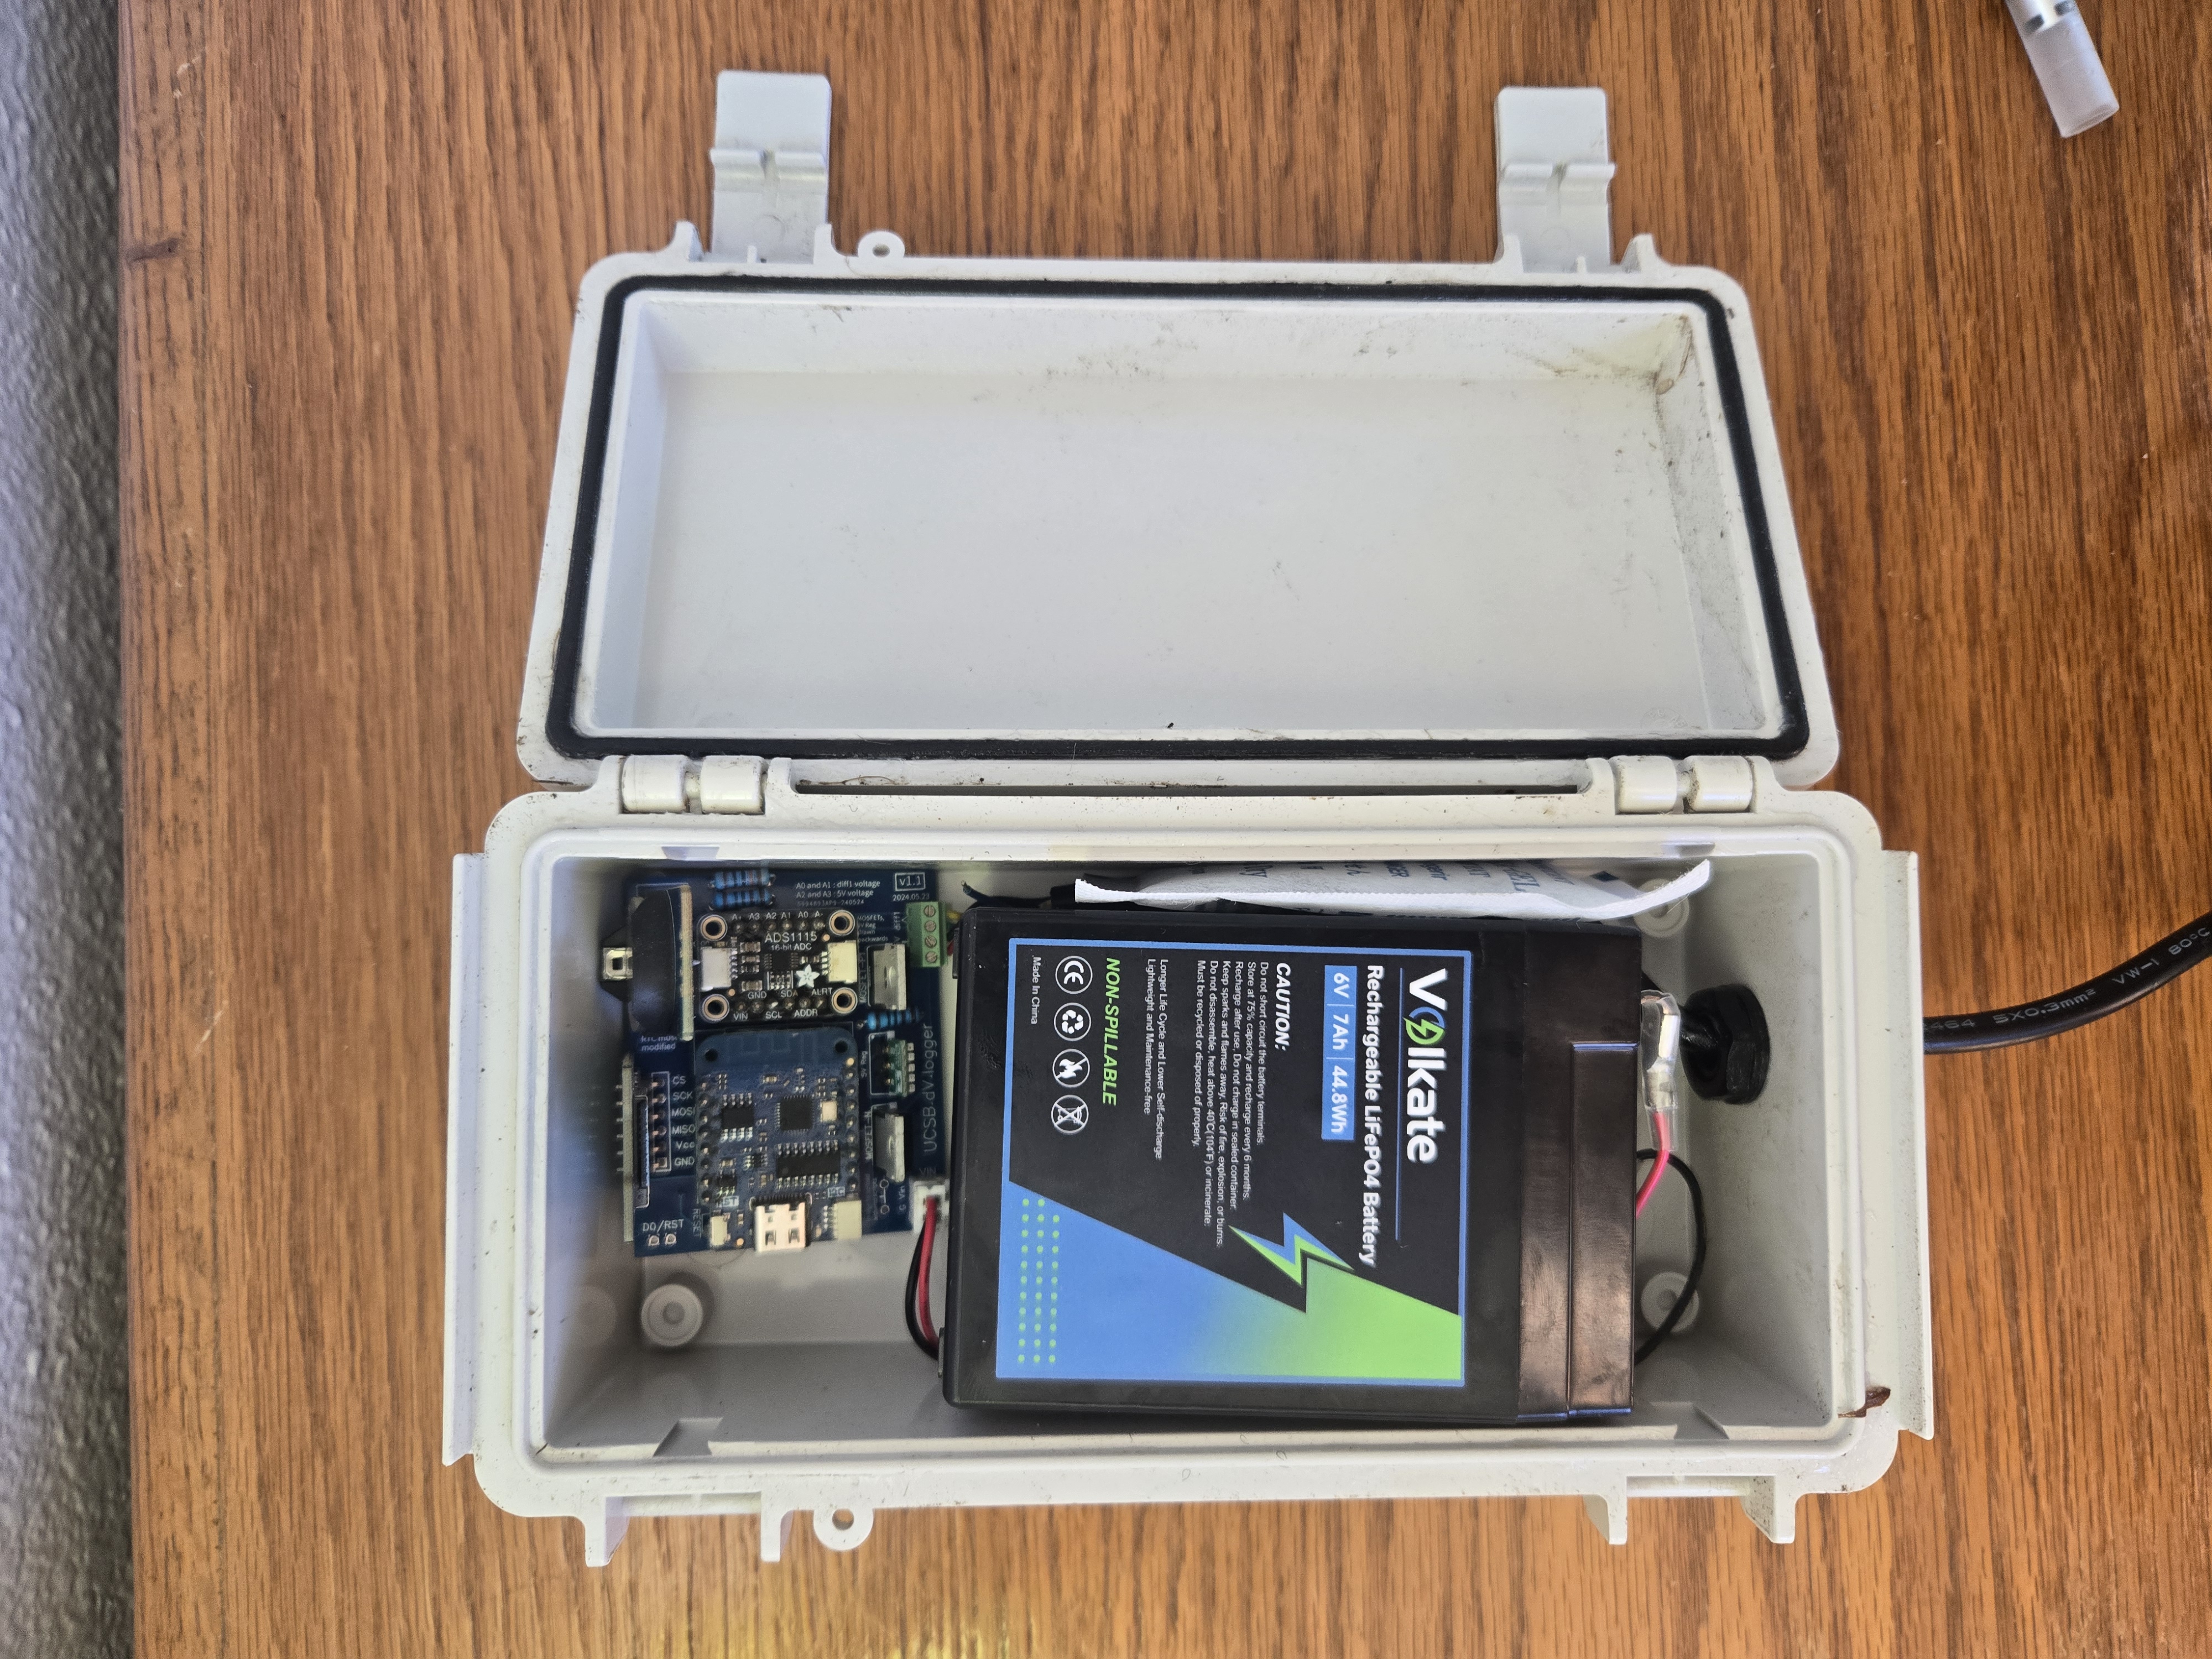
When preparing the case, I like to drill the cable gland hole pretty far to the side of the box that the wire terminals on the data logger will rest on (the right-hand side if looking into an open sensor box). The sensor pictured to the right doesn't really show this. But putting the hole farther to the right allows the cable to run straight up the side of the box without getting in the way of the battery.
Instead of the velcro "seatbelt" I used to hold the heavy battery packs on the sap flow sensors, I used velcro adhesive tape applied directly to the case and batteries to hold them in. This worked great on these lighter batteries.
Depending what kind of wiring comes with your batteries, you may need to crimp some male-JST to female spade connector wires. The same 20mm JST wire kits from the sap flow sensors can be used for this (but read the note on polarity in the sap flow tutorial).
Once your battery and case is ready, thread and lubricate the probe cable through the lubricated cable gland. If you're using a FloraPulse probe, you'll screw the wires colored Red, Black, Green, and Yellow from left to right when facing the open door of the sensor (the Blue wire is vestigial). Plug the battery in and tuck it to the left of the cable and onto the velcro tape, with the battery terminals facing downward (away from the logger). Put a desiccant packet in, tighten the cable gland, and clean and lubricate the door seal. Your sensor is now ready!
Programming the voltage logger
I use modified versions of the board configuration script and measurement script from the sap flow sensors. All of these scripts are descendants of the Js5 scripts, and there are many chunks of code and comments left over that no longer apply, so proceed carefully. But they do work, and are currently configured to take a differential voltage measurement every 30 minutes, including at night, with 10 ms of baseline measurement and 10 ms of measurements during the excitation pulse. During these measurement periods, voltage is logged every 1 ms.
I also made a test script that runs a measurement cycle every minute, in similar fashion as the sap flow test script.
Final thoughts
I make no guarantee that these designs will work for your purposes, nor would I claim that they are in any way "final"--anybody with a shred of engineering ability could surely make improvements! They were merely a means to an end for me, and I decided to cut off the design phase as soon as they seemed to work well enough. So I encourage future DIYers to improve upon these designs and let me know how it goes!
I owe tremendous thanks to DIY sapflow pioneer Justin Beslity, who graciously shared his knowledge and files with me, and to my fellow UCSB grad student Shadman Amin for his hard work testing and improving the sensors. UCSB grad students Shane Dewees, Bryn Morgan, and Emma Rigatti also contributed to these sensors' design, deployment, and data analysis. Huge thanks to Professors Kelly Caylor and Anna Trugman for letting me take over their lab spaces at UCSB, and to Lee Anderegg, Hillary Young, Tom Dudley, Alex Pivovaroff, Randy Long, and the Tetiaroa Society for facilitating field work and equipment acquisition.
Further thanks are due to Casey Wisely, who has been instrumental in the deployment and upkeep of these sensors on the Santa Clara River, and to my ace team of undergraduates and field assistants, AKA the Sap Flow Squad: Alex Fischer, Irina Roybal, Rayna Ruggeri, Nell Thompson, Talula Wilmot, Rebecca Sandoval, Marlys Kutach, Gianna Choy, Kimberly Wong, Mars Mezic, Schuyler Capita, Minh Tri Ngo, Jared Umphress, Michael Bliss-Schryer, Elizabeth Young, and Max Allen. Alex in particular deserves credit for much of the PCB redesign, and Talula for creating the tutorial video and many of the images on this page.